Berkshire Hathaway 2001 Annual Report Download - page 55
Download and view the complete annual report
Please find page 55 of the 2001 Berkshire Hathaway annual report below. You can navigate through the pages in the report by either clicking on the pages listed below, or by using the keyword search tool below to find specific information within the annual report.-
 1
1 -
2
-
3
-
4
-
5
-
6
-
7
-
8
-
9
-
10
-
11
-
12
-
13
-
14
-
15
-
16
-
17
-
18
-
19
-
20
-
21
-
22
-
23
-
24
-
25
-
26
-
27
-
28
-
29
-
30
-
31
-
32
-
33
-
34
-
35
-
36
-
37
-
38
-
39
-
40
-
41
-
42
-
43
-
44
-
 45
45 -
 46
46 -
 47
47 -
 48
48 -
 49
49 -
 50
50 -
 51
51 -
 52
52 -
 53
53 -
 54
54 -
 55
55 -
 56
56 -
 57
57 -
 58
58 -
 59
59 -
 60
60 -
 61
61 -
 62
62 -
 63
63 -
 64
64 -
 65
65 -
66
-
67
-
68
-
69
-
70
-
71
-
72
-
73
-
74
 |
 |

54
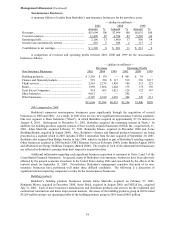
Management's Discussion (Continued)
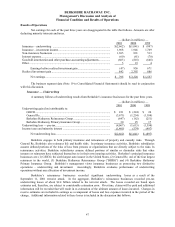
Non-Insurance Businesses
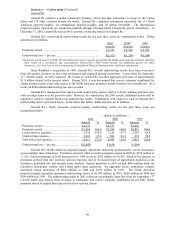
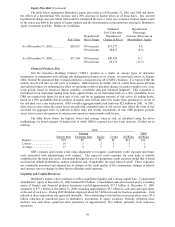
A summary follows of results from Berkshire’ s non-insurance businesses for the past three years.
— (dollars in millions) —
2001 2000 1999
Amount %Amount %Amount %
Revenues ...................................................................... $15,604 100 $7,994 100 $6,035 100
Cost and expenses ........................................................ 13,498 87 6,594 83 5,205 86
Operating profit............................................................ 2,106 13 1,400 17 830 14
Income taxes and minority interest .............................. 801 5 509 6 317 5
Contribution to net earnings......................................... $ 1,305 8 $ 891 11 $ 513 9
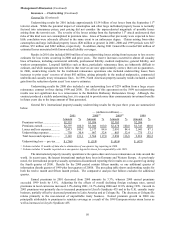
A comparison of revenues and operating profits between 2001, 2000 and 1999 for the non-insurance
businesses follows.
— (dollars in millions) —
Revenues Operating Profits
Non-Insurance Businesses 2001 2000 1999 2001 2000 1999
Building products ..................................................... $ 3,269 $ 178 — $ 461 $ 34 —
Finance and financial products................................. 519 530 $ 117 519 530 $117
Flight services........................................................... 2,563 2,279 1,856 186 213 225
Retail ........................................................................ 1,998 1,864 1,402 175 175 130
Scott Fetzer Companies............................................ 914 963 1,021 129 122 147
Shaw Industries ........................................................ 4,012 — — 292 — —
Other businesses ....................................................... 2,329 2,180 1,639 344 326 211
$15,604 $7,994 $6,035 $2,106 $1,400 $830
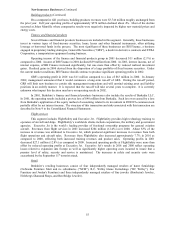
2001 compared to 2000
Berkshire's numerous non-insurance businesses grew significantly through the acquisition of several
businesses in 2000 and 2001. As a result, in 2001 there are two new significant non-insurance business segments.
One new segment is Shaw Industries ("Shaw"), in which Berkshire acquired an approximately 87.3% interest on
January 8, 2001. (Subsequent to December 31, 2001, Berkshire acquired the remaining interest in Shaw.) In
addition, the building products segment consists of four recently acquired businesses (MiTek Inc., acquired July 31,
2001, Johns Manville, acquired February 27, 2001, Benjamin Moore, acquired in December 2000 and Acme
Building Brands, acquired in August 2000). Also, Berkshire’ s finance and financial products businesses are being
presented as a segment which in 2001 includes XTRA Corporation from the date acquired of September 20, 2001.
Berkshire also acquired Ben Bridge Jeweler in July 2000, which is included as part of Berkshire's retailing segment.
Other businesses acquired in 2000 include CORT Business Services (February 2000), Justin Brands (August 2000)
and MidAmerican Energy Holdings Company (March 2000). The results of each of the aforementioned businesses
are reflected in Berkshire's earnings from their respective acquisition dates.
Additional information regarding each significant business acquisition is contained in Notes 2 and 3 of the
Consolidated Financial Statements. In general, many of Berkshire's non-insurance businesses have been adversely
affected by the general economic slowdown in the United States during 2001 and exacerbated by the effects of the
terrorist attack on September 11, 2001. Nevertheless, Berkshire's management considers that most of its non-
insurance businesses have performed well under these difficult conditions. The following is a discussion of
significant matters impacting comparative results for the non-insurance businesses.
Building products
Berkshire’ s building products businesses include Johns Manville, acquired on February 27, 2001,
Benjamin Moore, acquired in December 2000, Acme Brick, acquired in August 2000, and MiTek Inc., acquired
July 31, 2001. Each of these businesses manufactures and distributes products and services for the residential and
commercial construction and home improvement markets. Revenues of the building products group in 2001 totaled
$3,269 million and pre-tax operating profits of the building products group in 2001 totaled $461 million.