Berkshire Hathaway 2001 Annual Report Download - page 48
Download and view the complete annual report
Please find page 48 of the 2001 Berkshire Hathaway annual report below. You can navigate through the pages in the report by either clicking on the pages listed below, or by using the keyword search tool below to find specific information within the annual report.-
 1
1 -
2
-
3
-
4
-
5
-
6
-
7
-
8
-
9
-
10
-
11
-
12
-
13
-
14
-
15
-
16
-
17
-
18
-
19
-
20
-
21
-
22
-
23
-
24
-
25
-
26
-
27
-
28
-
29
-
30
-
31
-
32
-
33
-
34
-
35
-
36
-
37
-
 38
38 -
 39
39 -
 40
40 -
 41
41 -
 42
42 -
 43
43 -
 44
44 -
 45
45 -
 46
46 -
 47
47 -
 48
48 -
 49
49 -
 50
50 -
 51
51 -
 52
52 -
 53
53 -
 54
54 -
 55
55 -
 56
56 -
 57
57 -
 58
58 -
59
-
60
-
61
-
62
-
63
-
64
-
65
-
66
-
67
-
68
-
69
-
70
-
71
-
72
-
73
-
74
 |
 |

47
BERKSHIRE HATHAWAY INC.
Management's Discussion and Analysis of
Financial Condition and Results of Operations
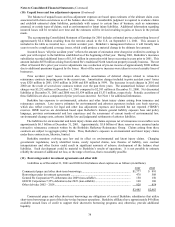
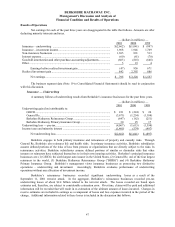
Results of Operations
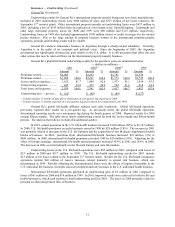
Net earnings for each of the past three years are disaggregated in the table that follows. Amounts are after
deducting minority interests and taxes.
— (dollars in millions) —
2001 2000 1999
Insurance – underwriting ................................................................................ $(2,662) $(1,041) $ (897)
Insurance – investment income........................................................................ 1,968 1,946 1,769
Non-insurance businesses ................................................................................ 1,305 891 513
Interest expense................................................................................................ (60) (61) (70)
Goodwill amortization and other purchase-accounting adjustments................ (603) (818) (648)
Other ................................................................................................................ 5 19 4
Earnings before realized investment gain............................................. (47) 936 671
Realized investment gain ................................................................................. 842 2,392 886
Net earnings.......................................................................................... $ 795 $ 3,328 $ 1,557
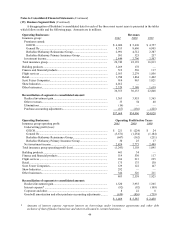
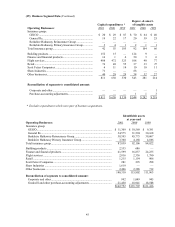
The business segment data (Note 19 to Consolidated Financial Statements) should be read in conjunction
with this discussion.
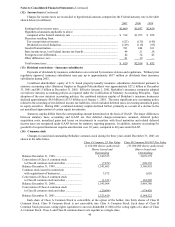
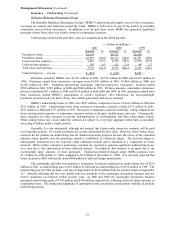
Insurance — Underwriting
A summary follows of underwriting results from Berkshire’ s insurance businesses for the past three years.
— (dollars in millions) —
2001 2000 1999
Underwriting gain (loss) attributable to:
GEICO........................................................................................................ $ 221 $ (224) $ 24
General Re.................................................................................................. (3,671) (1,254) (1,184)
Berkshire Hathaway Reinsurance Group ................................................... (647) (162) (251)
Berkshire Hathaway Primary Insurance Group.......................................... 30 25 17
Underwriting loss — pre-tax............................................................................ (4,067) (1,615) (1,394)
Income taxes and minority interest ................................................................. (1,405) (574) (497)
Net underwriting loss............................................................................ $(2,662) $(1,041) $ (897)
Berkshire engages in both primary insurance and reinsurance of property and casualty risks. Through
General Re, Berkshire also reinsures life and health risks. In primary insurance activities, Berkshire subsidiaries
assume defined portions of the risks of loss from persons or organizations that are directly subject to the risks. In
reinsurance activities, Berkshire subsidiaries assume defined portions of similar or dissimilar risks that other
insurers or reinsurers have subjected themselves to in their own insuring activities. Berkshire’ s principal insurance
businesses are: (1) GEICO, the sixth largest auto insurer in the United States, (2) General Re, one of the four largest
reinsurers in the world, (3) Berkshire Hathaway Reinsurance Group (“BHRG”) and (4) Berkshire Hathaway
Primary Insurance Group. Berkshire’ s management views insurance businesses as possessing two distinctive
operations – underwriting and investment. Accordingly, Berkshire evaluates performance of underwriting
operations without any allocation of investment income.
Berkshire’ s reinsurance businesses recorded significant underwriting losses as a result of the
September 11, 2001 terrorist attack. In the aggregate, Berkshire’ s reinsurance businesses recorded pre-tax
underwriting losses of about $2.4 billion related to the terrorist attack. The losses recorded are based upon
estimates and, therefore, are subject to considerable estimation error. Over time, claims will be paid and additional
information will be revealed that will result in re-estimation of the ultimate amount of losses incurred. Changes in
reserve estimates are included in earnings as a component of losses and loss expenses incurred in the period of the
change. Additional information related to these losses is included in the discussion that follows.