Berkshire Hathaway 2001 Annual Report Download - page 45
Download and view the complete annual report
Please find page 45 of the 2001 Berkshire Hathaway annual report below. You can navigate through the pages in the report by either clicking on the pages listed below, or by using the keyword search tool below to find specific information within the annual report.-
 1
1 -
2
-
3
-
4
-
5
-
6
-
7
-
8
-
9
-
10
-
11
-
12
-
13
-
14
-
15
-
16
-
17
-
18
-
19
-
20
-
21
-
22
-
23
-
24
-
25
-
26
-
27
-
28
-
29
-
30
-
31
-
32
-
33
-
34
-
 35
35 -
 36
36 -
 37
37 -
 38
38 -
 39
39 -
 40
40 -
 41
41 -
 42
42 -
 43
43 -
 44
44 -
 45
45 -
 46
46 -
 47
47 -
 48
48 -
 49
49 -
 50
50 -
 51
51 -
 52
52 -
 53
53 -
 54
54 -
 55
55 -
56
-
57
-
58
-
59
-
60
-
61
-
62
-
63
-
64
-
65
-
66
-
67
-
68
-
69
-
70
-
71
-
72
-
73
-
74
 |
 |

44
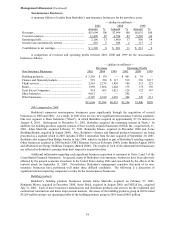
Notes to Consolidated Financial Statements (Continued)
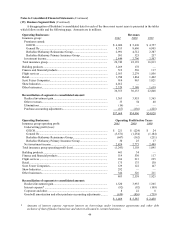
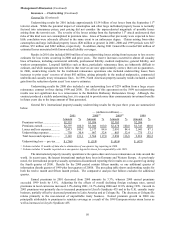
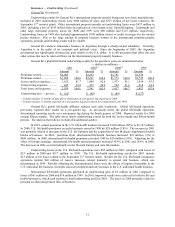
(19) Business Segment Data (Continued)
A disaggregation of Berkshire’ s consolidated data for each of the three most recent years is presented in the tables
which follow on this and the following page. Amounts are in millions.
Operating Businesses: Revenues
Insurance group: 2001 2000 1999
Premiums earned:
GEICO.................................................................................................... $ 6,060 $ 5,610 $ 4,757
General Re.............................................................................................. 8,353 8,696 6,905
Berkshire Hathaway Reinsurance Group................................................ 2,991 4,712 2,387
Berkshire Hathaway Primary Insurance Group ...................................... 501 325 257
Investment income..................................................................................... 2,844 2,796 2,507
Total insurance group................................................................................... 20,749 22,139 16,813
Building products ......................................................................................... 3,269 178 —
Finance and financial products..................................................................... 519 530 117
Flight services .............................................................................................. 2,563 2,279 1,856
Retail ............................................................................................................ 1,998 1,864 1,402
Scott Fetzer Companies................................................................................ 914 963 1,021
Shaw Industries ............................................................................................ 4,012 — —
Other businesses........................................................................................... 2,329 2,180 1,639
36,353 30,133 22,848
Reconciliation of segments to consolidated amount:
Realized investment gain........................................................................... 1,363 3,955 1,365
Other revenues........................................................................................... 35 54 40
Eliminations............................................................................................... (16) — —
Purchase-accounting adjustments.............................................................. (67) (136) (225)
$37,668 $34,006 $24,028
Operating Businesses: Operating Profit before Taxes
Insurance group operating profit: 2001 2000 1999
Underwriting profit (loss):
GEICO.................................................................................................... $ 221 $ (224) $ 24
General Re.............................................................................................. (3,671) (1,254) (1,184)
Berkshire Hathaway Reinsurance Group................................................ (647) (162) (251)
Berkshire Hathaway Primary Insurance Group ...................................... 30 25 17
Net investment income.............................................................................. 2,824 2,773 2,489
Total insurance group operating profit (loss) ............................................... (1,243) 1,158 1,095
Building products ......................................................................................... 461 34 —
Finance and financial products..................................................................... 519 530 117
Flight services .............................................................................................. 186 213 225
Retail ............................................................................................................ 175 175 130
Scott Fetzer Companies................................................................................ 129 122 147
Shaw Industries ............................................................................................ 292 — —
Other businesses........................................................................................... 344 326 211
863 2,558 1,925
Reconciliation of segments to consolidated amount:
Realized investment gain........................................................................... 1,320 3,955 1,365
Interest expense* ....................................................................................... (92) (92) (109)
Corporate and other................................................................................... 8 22 8
Goodwill amortization and other purchase-accounting adjustments ......... (630) (856) (739)
$ 1,469 $ 5,587 $ 2,450
* Amounts of interest expense represent interest on borrowings under investment agreements and other debt
exclusive of that of finance businesses and interest allocated to certain businesses.