Avon 2011 Annual Report Download - page 94
Download and view the complete annual report
Please find page 94 of the 2011 Avon annual report below. You can navigate through the pages in the report by either clicking on the pages listed below, or by using the keyword search tool below to find specific information within the annual report.-
 1
1 -
2
-
3
-
4
-
5
-
6
-
7
-
8
-
9
-
10
-
11
-
12
-
13
-
14
-
15
-
16
-
17
-
18
-
19
-
20
-
21
-
22
-
23
-
24
-
25
-
26
-
27
-
28
-
29
-
30
-
31
-
32
-
33
-
34
-
35
-
36
-
37
-
38
-
39
-
40
-
41
-
42
-
43
-
44
-
45
-
46
-
47
-
48
-
49
-
50
-
51
-
52
-
53
-
54
-
55
-
56
-
57
-
58
-
59
-
60
-
61
-
62
-
63
-
64
-
65
-
66
-
67
-
68
-
69
-
70
-
71
-
72
-
73
-
74
-
75
-
76
-
77
-
78
-
79
-
80
-
81
-
82
-
83
-
 84
84 -
 85
85 -
 86
86 -
 87
87 -
 88
88 -
 89
89 -
 90
90 -
 91
91 -
 92
92 -
 93
93 -
 94
94 -
 95
95 -
 96
96 -
 97
97 -
 98
98 -
 99
99 -
 100
100 -
 101
101 -
 102
102 -
 103
103 -
 104
104 -
105
-
106
-
107
-
108
 |
 |

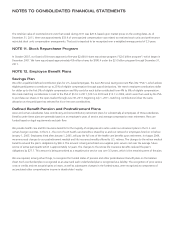
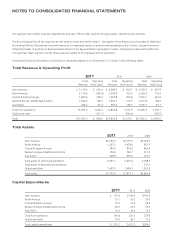
NOTES TO CONSOLIDATED FINANCIAL STATEMENTS
The segments have similar business characteristics and each offers similar products through similar customer access methods.
The accounting policies of the segments are the same as those described in Note 1, Description of the Business and Summary of Significant
Accounting Policies. We evaluate the performance of our segments based on revenues and operating profits or losses. Segment revenues
reflect direct sales of products to Representatives based on the Representative’s geographic location. Intersegment sales and transfers are
not significant. Each segment records direct expenses related to its employees and its operations.
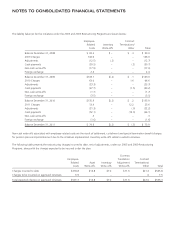
Summarized financial information concerning our reportable segments as of December 31 is shown in the following tables:
Total Revenue & Operating Profit
2011 2010 2009
Total
Revenue
Operating
Profit (Loss)
Total
Revenue
Operating
Profit (Loss)
Total
Revenue
Operating
Profit (Loss)
Latin America $ 5,116.0 $ 630.4 $ 4,589.5 $ 604.7 $ 4,103.2 $ 647.9
North America 2,110.4 (184.4) 2,244.0 155.9 2,293.4 110.4
Central & Eastern Europe 1,580.6 295.2 1,585.8 297.8 1,500.1 244.9
Western Europe, Middle East & Africa 1,542.2 183.7 1,462.1 176.5 1,277.8 84.2
Asia Pacific 942.4 81.4 981.4 82.6 1,030.7 81.7
Total from operations 11,291.6 1,006.3 10,862.8 1,317.5 10,205.2 1,169.1
Global and other – (151.7) – (244.4) – (163.5)
Total $11,291.6 $ 854.6 $10,862.8 $1,073.1 $10,205.2 $1,005.6
Total Assets
2011 2010 2009
Latin America $2,744.9 $2,757.6 $2,414.9
North America 1,207.2 1,478.0 831.5
Central & Eastern Europe 789.4 818.5 863.4
Western Europe, Middle East & Africa 726.8 782.7 611.0
Asia Pacific 628.8 630.6 617.7
Total assets of continuing operations 6,097.1 6,467.4 5,338.5
Total assets of discontinued operations – – 123.1
Global and other 1,637.9 1,406.3 1,361.8
Total assets $7,735.0 $7,873.7 $6,823.4
Capital Expenditures
2011 2010 2009
Latin America $ 115.9 $199.8 $160.6
North America 13.7 19.2 39.3
Central & Eastern Europe 21.6 31.4 29.3
Western Europe, Middle East & Africa 29.6 23.2 33.9
Asia Pacific 16.0 18.9 15.7
Total from operations 196.8 292.5 278.8
Global and other 79.9 38.7 17.5
Total capital expenditures $ 276.7 $331.2 $296.3