Avon 2011 Annual Report Download - page 45
Download and view the complete annual report
Please find page 45 of the 2011 Avon annual report below. You can navigate through the pages in the report by either clicking on the pages listed below, or by using the keyword search tool below to find specific information within the annual report.-
 1
1 -
2
-
3
-
4
-
5
-
6
-
7
-
8
-
9
-
10
-
11
-
12
-
13
-
14
-
15
-
16
-
17
-
18
-
19
-
20
-
21
-
22
-
23
-
24
-
25
-
26
-
27
-
28
-
29
-
30
-
31
-
32
-
33
-
34
-
 35
35 -
 36
36 -
 37
37 -
 38
38 -
 39
39 -
 40
40 -
 41
41 -
 42
42 -
 43
43 -
 44
44 -
 45
45 -
 46
46 -
 47
47 -
 48
48 -
 49
49 -
 50
50 -
 51
51 -
 52
52 -
 53
53 -
 54
54 -
 55
55 -
56
-
57
-
58
-
59
-
60
-
61
-
62
-
63
-
64
-
65
-
66
-
67
-
68
-
69
-
70
-
71
-
72
-
73
-
74
-
75
-
76
-
77
-
78
-
79
-
80
-
81
-
82
-
83
-
84
-
85
-
86
-
87
-
88
-
89
-
90
-
91
-
92
-
93
-
94
-
95
-
96
-
97
-
98
-
99
-
100
-
101
-
102
-
103
-
104
-
105
-
106
-
107
-
108
 |
 |

Total revenue during 2010 primarily increased as compared to 2009 as a result of an increase in Active Representatives. The region’s revenue
growth during 2010 was primarily due to significant growth in South Africa and Turkey, as well as the acquisition of Liz Earle, which
contributed approximately 3 points to revenue growth in 2010. During 2010, revenue increased 17% in Turkey and Constant $ revenue
increased 15% in Turkey, due primarily to strong growth in Active Representatives, driven by continued investments in RVP. During 2010,
revenue increased 82% in South Africa, partially benefiting from favorable foreign exchange. Constant $ revenue growth of 64% during
2010 in South Africa was primarily attributable to strong growth in Active Representatives, driven by investments in RVP, and the expansion
of our geographic reach in the country. During 2010, revenue increased by 1% in the United Kingdom, while Constant $ revenue increased
by 3% due to a growth in Active Representatives, partially offset by a lower average order.
During 2010, operating margin benefited by 2.3 points due to lower CTI restructuring compared to the prior year. On an Adjusted
Non-GAAP basis, excluding CTI restructuring, the increase in operating margin during 2010 was primarily driven by improvements in gross
margin, driven by improved manufacturing productivity, including the benefits of SSI.
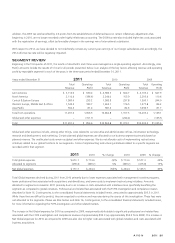
Asia Pacific – 2011 Compared to 2010
%/Point Change
2011 2010 US$ Constant $
Total revenue $942.4 $981.4 (4)% (9)%
Operating profit 81.4 82.6 (1)% (13)%
CTI restructuring (.3) (.3)
Adjusted Non-GAAP operating profit 81.1 82.3 (1)% (13)%
Operating margin 8.6% 8.4% .2 (.3)
CTI restructuring – –
Adjusted Non-GAAP operating margin 8.6% 8.4% .2 (.3)
Units sold (9)%
Active Representatives (11)%
Amounts in the table above may not necessarily sum because the computations are made independently.
Beginning in the first quarter of 2011, the results of Asia Pacific and China were managed as a single operating segment. Accordingly, Asia
Pacific amounts include the results of China for all periods presented. In addition, the region’s results for all periods exclude Japan, which
was sold in 2010 and classified as a discontinued operation.
Total revenue during 2011 declined primarily due to a decrease in Active Representatives, partially offset by favorable foreign exchange.
Revenue grew 3% in the Philippines during 2011, benefiting from favorable foreign exchange. Constant $ revenue in the Philippines
declined 1% in 2011 reflecting increased competitive activity. The region’s results were negatively impacted by a continued decline in
skincare sales during 2011.
Revenue declined 20% in China during 2011, or 24% in Constant $. In 2011, we continued the rollout of service centers to support direct
selling. As we continue to transition towards direct selling, we are focused on improving the productivity of Representatives.
Adjusted Non-GAAP operating margin increased during 2011, primarily due to lower advertising costs, as well as favorable foreign
exchange. The favorable impact of these items was partially offset by lower gross margin and higher RVP spending. With regards to gross
margin, while favorable pricing offset higher commodity costs, gross margin declined due to adverse product mix.
A V O N 2011 37