Avon 2011 Annual Report Download - page 90
Download and view the complete annual report
Please find page 90 of the 2011 Avon annual report below. You can navigate through the pages in the report by either clicking on the pages listed below, or by using the keyword search tool below to find specific information within the annual report.-
 1
1 -
2
-
3
-
4
-
5
-
6
-
7
-
8
-
9
-
10
-
11
-
12
-
13
-
14
-
15
-
16
-
17
-
18
-
19
-
20
-
21
-
22
-
23
-
24
-
25
-
26
-
27
-
28
-
29
-
30
-
31
-
32
-
33
-
34
-
35
-
36
-
37
-
38
-
39
-
40
-
41
-
42
-
43
-
44
-
45
-
46
-
47
-
48
-
49
-
50
-
51
-
52
-
53
-
54
-
55
-
56
-
57
-
58
-
59
-
60
-
61
-
62
-
63
-
64
-
65
-
66
-
67
-
68
-
69
-
70
-
71
-
72
-
73
-
74
-
75
-
76
-
77
-
78
-
79
-
 80
80 -
 81
81 -
 82
82 -
 83
83 -
 84
84 -
 85
85 -
 86
86 -
 87
87 -
 88
88 -
 89
89 -
 90
90 -
 91
91 -
 92
92 -
 93
93 -
 94
94 -
 95
95 -
 96
96 -
 97
97 -
 98
98 -
 99
99 -
 100
100 -
101
-
102
-
103
-
104
-
105
-
106
-
107
-
108
 |
 |

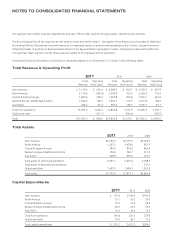
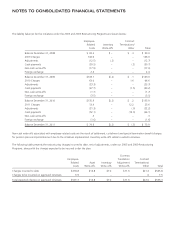
NOTES TO CONSOLIDATED FINANCIAL STATEMENTS
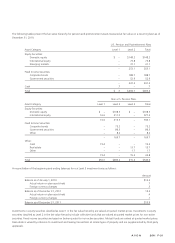
Plan Assets
Our U.S. and non-U.S. funded pension and postretirement plans target and weighted-average asset allocations at December 31, 2011 and
2010, by asset category were as follows:
U.S. Pension Plan Non-U.S. Pension Plans U.S. Postretirement Plan
% of Plan Assets % of Plan Assets % of Plan Assets
Target at Year End Target at Year End Target at Year End
Asset Category 2012 2011 2010 2012 2011 2010 2012 2011 2010
Equity securities 55-60% 57% 55% 55-65% 61% 61% 50% 47% –%
Debt securities 35-40 35 37 30-40 32 33 50 53 100
Real Estate – – – – 3 2 – – –
Other 0-10 8 8 0-10 4 4 – – –
Total 100% 100% 100% 100% 100% 100% 100% 100% 100%
The following tables present the fair value hierarchy for pension and postretirement assets measured at fair value on a recurring basis as of
December 31, 2011:
U.S. Pension and Postretirement Plans
Asset Category Level 1 Level 2 Total
Equity Securities:
Domestic equity $ – $193.3 $193.3
International equity – 64.4 64.4
Emerging markets – 42.7 42.7
– 300.4 300.4
Fixed Income Securities:
Corporate bonds – 180.7 180.7
Government securities – 53.3 53.3
– 234.0 234.0
Cash 1.6 – 1.6
Total $ 1.6 $534.4 $536.0
Non-U.S. Pension Plans
Asset Category Level 1 Level 2 Level 3 Total
Equity Securities:
Domestic equity $ 14.7 $104.4 $ – $119.1
International equity – 206.2 – 206.2
14.7 310.6 – 325.3
Fixed Income Securities:
Corporate bonds – 64.3 – 64.3
Government securities – 103.4 – 103.4
Other – 7.9 – 7.9
– 175.6 – 175.6
Other:
Cash 19.6 – – 19.6
Real estate – – 14.6 14.6
Other – – 1.3 1.3
19.6 – 15.9 35.5
Total $ 34.3 $486.2 $15.9 $536.4