Avon 2011 Annual Report Download - page 44
Download and view the complete annual report
Please find page 44 of the 2011 Avon annual report below. You can navigate through the pages in the report by either clicking on the pages listed below, or by using the keyword search tool below to find specific information within the annual report.-
 1
1 -
2
-
3
-
4
-
5
-
6
-
7
-
8
-
9
-
10
-
11
-
12
-
13
-
14
-
15
-
16
-
17
-
18
-
19
-
20
-
21
-
22
-
23
-
24
-
25
-
26
-
27
-
28
-
29
-
30
-
31
-
32
-
33
-
 34
34 -
 35
35 -
 36
36 -
 37
37 -
 38
38 -
 39
39 -
 40
40 -
 41
41 -
 42
42 -
 43
43 -
 44
44 -
 45
45 -
 46
46 -
 47
47 -
 48
48 -
 49
49 -
 50
50 -
 51
51 -
 52
52 -
 53
53 -
 54
54 -
55
-
56
-
57
-
58
-
59
-
60
-
61
-
62
-
63
-
64
-
65
-
66
-
67
-
68
-
69
-
70
-
71
-
72
-
73
-
74
-
75
-
76
-
77
-
78
-
79
-
80
-
81
-
82
-
83
-
84
-
85
-
86
-
87
-
88
-
89
-
90
-
91
-
92
-
93
-
94
-
95
-
96
-
97
-
98
-
99
-
100
-
101
-
102
-
103
-
104
-
105
-
106
-
107
-
108
 |
 |

PART II
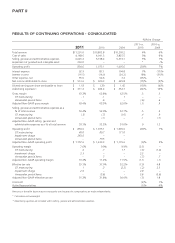
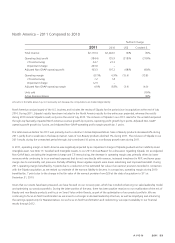
Western Europe, Middle East & Africa – 2011 Compared to 2010
%/Point Change
2011 2010 US$ Constant $
Total revenue $1,542.2 $1,462.1 5% 5%
Operating profit 183.7 176.5 4% 2%
CTI restructuring 2.8 1.6
Adjusted Non-GAAP operating profit 186.5 178.1 5% 3%
Operating margin 11.9% 12.1% (.2) (.3)
CTI restructuring .2 .1
Adjusted Non-GAAP operating margin 12.1% 12.2% (.1) (.2)
Units sold 1%
Active Representatives 4%
Amounts in the table above may not necessarily sum because the computations are made independently.
Total revenue during 2011 increased primarily as a result of an increase in Active Representatives. The region’s revenue growth for 2011 was
primarily due to significant growth in South Africa, partially offset by a revenue decline in the United Kingdom. Additionally, total revenue in
2011 was favorably impacted by approximately 1 point due to a benefit to the United Kingdom’s revenue resulting from the settlement of a
long time dispute associated with an estimated Value Added Tax (“VAT”) liability which was initially recognized as a reduction to revenue.
The region experienced Constant $ growth through the first nine months of 2011 but saw declines in the fourth quarter, partly due to the
negative impact of the continued difficult economic environment on Fashion and Home sales. The inclusion of Liz Earle in our 2011 results
for the unmatched period through March favorably impacted the region’s revenue growth by 1 point.
During 2011, revenue in South Africa increased 31%, partially benefiting from favorable foreign exchange. On a Constant $ basis, revenue
in South Africa increased 29%, due to growth in Active Representatives. During 2011, revenue in Turkey declined 5%, due to unfavorable
foreign exchange, while on a Constant $ basis Turkey grew 5%, due to growth in Active Representatives and higher average order. In the
United Kingdom, revenue declined by 1% in 2011 including benefits from favorable foreign exchange as well as the VAT settlement. On a
Constant $ basis, revenue in the United Kingdom in 2011 declined by 4%, primarily due to a decline in Active Representatives and lower
average order, partially offset by the VAT settlement, which benefited Constant $ growth rates by 4 points.
The decreases in operating margin and Adjusted Non-GAAP operating margin in 2011, were primarily driven by a decline in gross margin
due to higher commodity costs and the negative impact from foreign exchange, partially offset by the favorable impact of the revenue
associated with the VAT settlement and reduced overhead spending.
Western Europe, Middle East & Africa – 2010 Compared to 2009
%/Point Change
2010 2009 US$ Constant $
Total revenue $1,462.1 $1,277.8 14% 15%
Operating profit 176.5 84.2 110% 107%
CTI restructuring 1.6 31.0
Adjusted Non-GAAP operating profit 178.1 115.2 55% 56%
Operating margin 12.1% 6.6% 5.5 5.5
CTI restructuring .1 2.4
Adjusted Non-CAAP operating margin 12.2% 9.0% 3.2 3.2
Units sold 12%
Active Representatives 12%
Amounts in the table above may not necessarily sum because the computations are made independently.