Avon 2011 Annual Report Download - page 37
Download and view the complete annual report
Please find page 37 of the 2011 Avon annual report below. You can navigate through the pages in the report by either clicking on the pages listed below, or by using the keyword search tool below to find specific information within the annual report.-
 1
1 -
2
-
3
-
4
-
5
-
6
-
7
-
8
-
9
-
10
-
11
-
12
-
13
-
14
-
15
-
16
-
17
-
18
-
19
-
20
-
21
-
22
-
23
-
24
-
25
-
26
-
 27
27 -
 28
28 -
 29
29 -
 30
30 -
 31
31 -
 32
32 -
 33
33 -
 34
34 -
 35
35 -
 36
36 -
 37
37 -
 38
38 -
 39
39 -
 40
40 -
 41
41 -
 42
42 -
 43
43 -
 44
44 -
 45
45 -
 46
46 -
 47
47 -
48
-
49
-
50
-
51
-
52
-
53
-
54
-
55
-
56
-
57
-
58
-
59
-
60
-
61
-
62
-
63
-
64
-
65
-
66
-
67
-
68
-
69
-
70
-
71
-
72
-
73
-
74
-
75
-
76
-
77
-
78
-
79
-
80
-
81
-
82
-
83
-
84
-
85
-
86
-
87
-
88
-
89
-
90
-
91
-
92
-
93
-
94
-
95
-
96
-
97
-
98
-
99
-
100
-
101
-
102
-
103
-
104
-
105
-
106
-
107
-
108
 |
 |

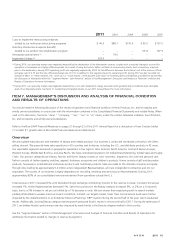
addition, the 2009 tax rate benefited by 2.0 points from the establishment of deferred taxes on certain inflationary adjustments that,
beginning in 2010, are no longer recorded under highly inflationary accounting. The 2009 tax rate also included higher tax costs associated
with the repatriation of earnings, offset by favorable changes in the earnings mix of international subsidiaries.
With respect to 2012, we have decided to not indefinitely reinvest any current year earnings of our foreign subsidiaries and, accordingly, the
2012 effective tax rate will be negatively impacted.
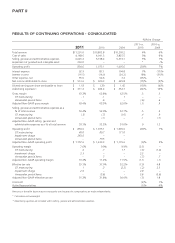
SEGMENT REVIEW
Beginning in the first quarter of 2011, the results of Asia Pacific and China were managed as a single operating segment. Accordingly, Asia
Pacific amounts include the results of China for all periods presented. Below is an analysis of the key factors affecting revenue and operating
profit by reportable segment for each of the years in the three-year period ended December 31, 2011.
Years ended December 31 2011 2010 2009
Total
Revenue
Operating
Profit
Total
Revenue
Operating
Profit
Total
Revenue
Operating
Profit
Latin America $ 5,116.0 $ 630.4 $ 4,589.5 $ 604.7 $ 4,103.2 $ 647.9
North America 2,110.4 (184.4) 2,244.0 155.9 2,293.4 110.4
Central & Eastern Europe 1,580.6 295.2 1,585.8 297.8 1,500.1 244.9
Western Europe, Middle East & Africa 1,542.2 183.7 1,462.1 176.5 1,277.8 84.2
Asia Pacific 942.4 81.4 981.4 82.6 1,030.7 81.7
Total from operations 11,291.6 1,006.3 10,862.8 1,317.5 10,205.2 1,169.1
Global and other expenses – (151.7) – (244.4) – (163.5)
Total $11,291.6 $ 854.6 $10,862.8 $1,073.1 $10,205.2 $1,005.6
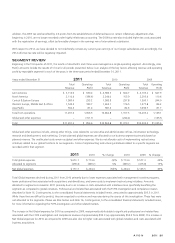
Global and other expenses include, among other things, costs related to our executive and administrative offices, information technology,
research and development, and marketing. Certain planned global expenses are allocated to our business segments primarily based on
planned revenue. The unallocated costs remain as global and other expenses. We do not allocate costs of implementing restructuring
initiatives related to our global functions to our segments. Costs of implementing restructuring initiatives related to a specific segment are
recorded within that segment.
2011 2010 % Change 2010 2009 % Change
Total global expenses $ 651.1 $ 713.6 (9)% $ 713.6 $ 577.3 24%
Allocated to segments (499.4) (469.2) 6% (469.2) (413.8) 13%
Net global expenses $ 151.7 $ 244.4 (38)% $ 244.4 $ 163.5 49%
Total Global expenses declined during 2011 from 2010 primarily due to lower expenses associated with management incentive programs,
lower professional fees associated with acquisitions and divestitures, and lower costs to implement restructuring initiatives. Amounts
allocated to segments increased in 2011 primarily due to an increase in costs associated with initiatives more specifically benefiting the
segments as compared to global initiatives. Professional and related fees associated with the FCPA investigation and compliance reviews
described in Note 16, Contingencies, to the consolidated financial statements included herein, amounted to approximately $93.3 in 2011.
While these fees are difficult to predict, they are expected to continue and may vary during the course of this investigation. These fees were
not allocated to the segments. Please see Risk Factors and Note 16, Contingencies, to the consolidated financial statements included herein,
for more information regarding the FCPA investigation and other related matters.
The increase in Net Global expenses for 2010 as compared to 2009, was primarily attributable to significant professional and related fees
associated with the FCPA investigation and compliance reviews of approximately $95.3 (up approximately $59.0 from 2009). The increase in
Net Global expenses for 2010 as compared to 2009 was also due to higher costs associated with global initiatives and costs associated with
business acquisitions.
A V O N 2011 29