Avon 2011 Annual Report Download - page 30
Download and view the complete annual report
Please find page 30 of the 2011 Avon annual report below. You can navigate through the pages in the report by either clicking on the pages listed below, or by using the keyword search tool below to find specific information within the annual report.-
 1
1 -
2
-
3
-
4
-
5
-
6
-
7
-
8
-
9
-
10
-
11
-
12
-
13
-
14
-
15
-
16
-
17
-
18
-
19
-
 20
20 -
 21
21 -
 22
22 -
 23
23 -
 24
24 -
 25
25 -
 26
26 -
 27
27 -
 28
28 -
 29
29 -
 30
30 -
 31
31 -
 32
32 -
 33
33 -
 34
34 -
 35
35 -
 36
36 -
 37
37 -
 38
38 -
 39
39 -
 40
40 -
41
-
42
-
43
-
44
-
45
-
46
-
47
-
48
-
49
-
50
-
51
-
52
-
53
-
54
-
55
-
56
-
57
-
58
-
59
-
60
-
61
-
62
-
63
-
64
-
65
-
66
-
67
-
68
-
69
-
70
-
71
-
72
-
73
-
74
-
75
-
76
-
77
-
78
-
79
-
80
-
81
-
82
-
83
-
84
-
85
-
86
-
87
-
88
-
89
-
90
-
91
-
92
-
93
-
94
-
95
-
96
-
97
-
98
-
99
-
100
-
101
-
102
-
103
-
104
-
105
-
106
-
107
-
108
 |
 |
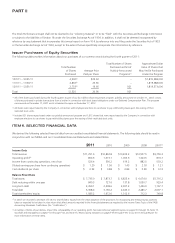
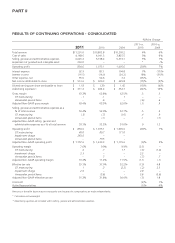
PART II
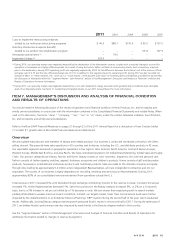
We present gross margin, selling, general and administrative expenses as a percentage of revenue, operating profit, operating margin and
effective tax rate on a non-GAAP basis. The discussion of our segments presents operating profit and operating margin on a non-GAAP
basis. We have provided a quantitative reconciliation of the difference between the non-GAAP financial measure and the financial measure
calculated and reported in accordance with GAAP. These non-GAAP measures should not be considered in isolation, or as a substitute for,
or superior to, financial measures calculated in accordance with GAAP. The Company uses the non-GAAP financial measures to evaluate its
operating performance and believes that it is meaningful for investors to be made aware of, on a period-to-period basis, the impacts of 1)
costs to implement (“CTI”) restructuring initiatives, 2) goodwill and indefinite-lived intangible impairment charge related to Silpada
(“Impairment charge”), and 3) costs and charges related to Venezuela being designated as a highly inflationary economy and the
subsequent devaluation of its currency in January 2010 (“Venezuelan special items”). The Company believes investors find the non-GAAP
information helpful in understanding the ongoing performance of operations separate from items that may have a disproportionate positive
or negative impact on the Company’s financial results in any particular period. The Impairment charge includes the impact on the Statement
of Income caused by the goodwill and indefinite-lived intangible impairment charge related to Silpada in 2011. The Venezuelan special items
include the impact on the Statement of Income caused by the devaluation of the Venezuelan currency on monetary assets and liabilities,
such as cash, receivables and payables; deferred tax assets and liabilities; and nonmonetary assets, such as inventory and prepaid expenses.
For nonmonetary assets, the Venezuelan special items include the earnings impact caused by the difference between the historical cost of
the assets at the previous official exchange rate of 2.15 and the revised official exchange rate of 4.30.
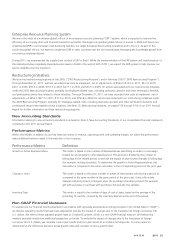
Critical Accounting Estimates
We believe the accounting policies described below represent our critical accounting policies due to the estimation processes involved in
each. See Note 1, Description of the Business and Summary of Significant Accounting Policies, to our 2011 Annual Report for a detailed
discussion of the application of these and other accounting policies.
Restructuring Reserves
We record the estimated expense for our restructuring initiatives as such costs are deemed probable and estimable, when approved by the
appropriate corporate authority and by accumulating detailed estimates of costs for such plans. These expenses include the estimated costs
of employee severance and related benefits, impairment of property, plant and equipment, and any other qualifying exit costs. These
estimated costs are grouped by specific projects within the overall plan and are then monitored on a quarterly basis by finance personnel.
Such costs represent our best estimate, but require assumptions about the programs that may change over time, including attrition rates.
Estimates are evaluated periodically to determine if an adjustment is required.
Allowances for Doubtful Accounts Receivable
Representatives contact their customers, selling primarily through the use of brochures for each sales campaign. Sales campaigns are
generally for a two-week duration in the U.S. and a two- to four-week duration outside the U.S. The Representative purchases products
directly from us and may or may not sell them to an end user. In general, the Representative, an independent contractor, remits a payment
to us each sales campaign, which relates to the prior campaign cycle. The Representative is generally precluded from submitting an order for
the current sales campaign until the accounts receivable balance for the prior campaign is paid; however, there are circumstances where the
Representative fails to make the required payment. We record an estimate of an allowance for doubtful accounts on receivable balances
based on an analysis of historical data and current circumstances, including selling schedules, business operations, seasonality and changing
trends. Over the past three years, annual bad debt expense has been in the range of $215 to $248, or approximately 2.0% of total revenue.
Bad debt expense, as a percent of revenue increased by .2 points in 2011 as compared to 2010, primarily in Latin America. The allowance
for doubtful accounts is reviewed for adequacy, at a minimum, on a quarterly basis. We generally have no detailed information concerning,
or any communication with, any end user of our products beyond the Representative. We have no legal recourse against the end user for
the collectability of any accounts receivable balances due from the Representative to us. If the financial condition of our Representatives
were to deteriorate, resulting in an impairment of their ability to make payments, additional allowances may be required.
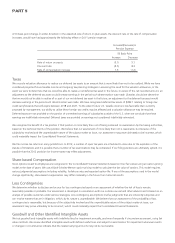
Allowances for Sales Returns
We record a provision for estimated sales returns based on historical experience with product returns. Over the past three years, sales returns have
been in the range of $370 to $447, or approximately 3.8% of total revenue. If the historical data we use to calculate these estimates does not
approximate future returns, due to changes in marketing or promotional strategies, or for other reasons, additional allowances may be required.