Avon 2011 Annual Report Download - page 41
Download and view the complete annual report
Please find page 41 of the 2011 Avon annual report below. You can navigate through the pages in the report by either clicking on the pages listed below, or by using the keyword search tool below to find specific information within the annual report.-
 1
1 -
2
-
3
-
4
-
5
-
6
-
7
-
8
-
9
-
10
-
11
-
12
-
13
-
14
-
15
-
16
-
17
-
18
-
19
-
20
-
21
-
22
-
23
-
24
-
25
-
26
-
27
-
28
-
29
-
30
-
 31
31 -
 32
32 -
 33
33 -
 34
34 -
 35
35 -
 36
36 -
 37
37 -
 38
38 -
 39
39 -
 40
40 -
 41
41 -
 42
42 -
 43
43 -
 44
44 -
 45
45 -
 46
46 -
 47
47 -
 48
48 -
 49
49 -
 50
50 -
 51
51 -
52
-
53
-
54
-
55
-
56
-
57
-
58
-
59
-
60
-
61
-
62
-
63
-
64
-
65
-
66
-
67
-
68
-
69
-
70
-
71
-
72
-
73
-
74
-
75
-
76
-
77
-
78
-
79
-
80
-
81
-
82
-
83
-
84
-
85
-
86
-
87
-
88
-
89
-
90
-
91
-
92
-
93
-
94
-
95
-
96
-
97
-
98
-
99
-
100
-
101
-
102
-
103
-
104
-
105
-
106
-
107
-
108
 |
 |

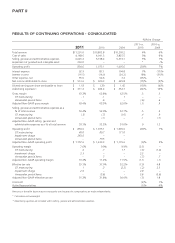
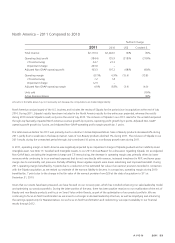
North America – 2011 Compared to 2010
%/Point Change
2011 2010 US$ Constant $
Total revenue $2,110.4 $2,244.0 (6)% (6)%
Operating (loss) profit (184.4) 155.9 (218)% (219)%
CTI restructuring 24.7 41.3
Impairment charge 263.0 –
Adjusted Non-GAAP operating profit 103.3 197.2 (48)% (49)%
Operating margin (8.7)% 6.9% (15.6) (15.8)
CTI restructuring 1.2 1.8
Impairment charge 12.5 –
Adjusted Non-GAAP operating margin 4.9% 8.8% (3.9) (4.0)
Units sold (10)%
Active Representatives (8)%
Amounts in the table above may not necessarily sum because the computations are made independently.
North America consists largely of the U.S. business and includes the results of Silpada for the period since its acquisition at the end of July
2010. During 2011, Silpada’s results have been included in the North America results for the entire year presented, whereas the results
during 2010 include Silpada’s results only since the end of July 2010. The inclusion of Silpada in our 2011 results for the unmatched period
through July favorably impacted North America revenue growth by 4 points, operating profit growth by 6 points, Adjusted Non-GAAP
operating profit growth by 1 point, and Adjusted Non-GAAP operating profit margin growth by .1 point.
The total revenue decline for 2011 was primarily due to a decline in Active Representatives. Sales of Beauty products decreased 6% during
2011, partly due to weakness in the beauty market. Sales of non-Beauty products declined 7% during 2011. The inclusion of Silpada in our
2011 results during the unmatched period through July contributed 10 points to non-Beauty growth rates during 2011.
In 2011, operating margin in North America was negatively impacted by an impairment charge of Silpada goodwill and an indefinite-lived
intangible asset. See Note 17, Goodwill and Intangible Assets, to our 2011 Annual Report for a discussion regarding Silpada. On an Adjusted
Non-GAAP basis, excluding the impairment charge and CTI restructuring, the decrease in operating margin was primarily driven by lower
revenues while continuing to incur overhead expenses that do not vary directly with revenue, increased investment in RVP, and lower gross
margin due to commodity cost pressures. Partially offsetting these negative impacts were lower advertising and improved bad debt. During
2011, operating margin benefited by .5 points due to a reduction in the estimated fair value of an earnout provision recorded in connection
with the Silpada acquisition, as we revised our estimate of the earnout liability to be zero. In comparison, operating margin during 2010
benefited by .7 points due to the change in the fair value of the earnout provision from $26 at the date of acquisition to $11 at
December 31, 2010.
Given that our results have been pressured, we have focused on our recovery plan, which has included enhancing our sales leadership model
and optimizing our product portfolio. During the latter portion of the year, there has been positive reaction to our recalibration of the mix of
Beauty and non-Beauty products and focus on Smart Value within Beauty, as part of the optimization of our product portfolio. We are
continuing to focus on field transformation as we move to a stronger multi-level leadership structure, as well as simplifying and enhancing
the earnings opportunity for Representatives. As we focus on field transformation and redistricting, we expect variability in our financial
results through 2012.
A V O N 2011 33