Avon 2011 Annual Report Download - page 92
Download and view the complete annual report
Please find page 92 of the 2011 Avon annual report below. You can navigate through the pages in the report by either clicking on the pages listed below, or by using the keyword search tool below to find specific information within the annual report.-
 1
1 -
2
-
3
-
4
-
5
-
6
-
7
-
8
-
9
-
10
-
11
-
12
-
13
-
14
-
15
-
16
-
17
-
18
-
19
-
20
-
21
-
22
-
23
-
24
-
25
-
26
-
27
-
28
-
29
-
30
-
31
-
32
-
33
-
34
-
35
-
36
-
37
-
38
-
39
-
40
-
41
-
42
-
43
-
44
-
45
-
46
-
47
-
48
-
49
-
50
-
51
-
52
-
53
-
54
-
55
-
56
-
57
-
58
-
59
-
60
-
61
-
62
-
63
-
64
-
65
-
66
-
67
-
68
-
69
-
70
-
71
-
72
-
73
-
74
-
75
-
76
-
77
-
78
-
79
-
80
-
81
-
 82
82 -
 83
83 -
 84
84 -
 85
85 -
 86
86 -
 87
87 -
 88
88 -
 89
89 -
 90
90 -
 91
91 -
 92
92 -
 93
93 -
 94
94 -
 95
95 -
 96
96 -
 97
97 -
 98
98 -
 99
99 -
 100
100 -
 101
101 -
 102
102 -
103
-
104
-
105
-
106
-
107
-
108
 |
 |

NOTES TO CONSOLIDATED FINANCIAL STATEMENTS
The overall objective of our U.S. pension plan is to provide the means to pay benefits to participants and their beneficiaries in the amounts
and at the times called for by the plan. This is expected to be achieved through the investment of our contributions and other trust assets
and by utilizing investment policies designed to achieve adequate funding over a reasonable period of time.
Pension trust assets are invested so as to achieve a return on investment, based on levels of liquidity and investment risk that is prudent and
reasonable as circumstances change from time to time. While we recognize the importance of the preservation of capital, we also adhere to
the theory of capital market pricing which maintains that varying degrees of investment risk should be rewarded with compensating returns.
Consequently, prudent risk-taking is justifiable.
The asset allocation decision includes consideration of the non-investment aspects of the Avon Products, Inc. Personal Retirement Account
Plan, including future retirements, lump-sum elections, growth in the number of participants, company contributions, and cash flow. These
characteristics of the plan place certain demands upon the level, risk, and required growth of trust assets. We regularly conduct analyses of
the plan’s current and likely future financial status by forecasting assets, liabilities, benefits and company contributions over time. In so
doing, the impact of alternative investment policies upon the plan’s financial status is measured and an asset mix which balances asset
returns and risk is selected.
Our decision with regard to asset mix is reviewed periodically. Asset mix guidelines include target allocations and permissible ranges for each
asset category. Assets are monitored on an ongoing basis and rebalanced as required to maintain an asset mix within the permissible ranges.
The guidelines will change from time to time, based on an ongoing evaluation of the plan’s tolerance of investment risk.
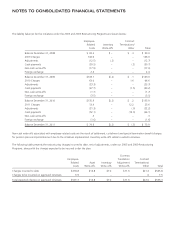
Cash flows
We expect to make contributions in the range of $40 to $45 to our U.S. pension and postretirement plans and in the range of $40 to $45 to
our international pension and postretirement plans during 2012.
Total benefit payments expected to be paid from the plans are as follows:
Pension Benefits
U.S. Plans
Non-U.S.
Plans Total
Postretirement
Benefits
2012 $ 65.8 $ 39.4 $105.2 $11.2
2013 62.3 39.3 101.6 9.5
2014 61.0 40.3 101.3 9.4
2015 55.6 43.2 98.8 9.3
2016 55.4 42.1 97.5 9.2
2017 - 2021 300.9 246.1 547.0 44.4
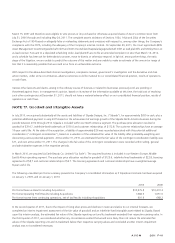
Postretirement Benefits
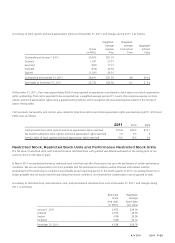
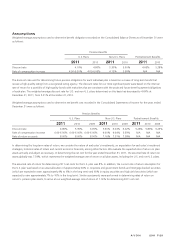
For 2011, the assumed rate of future increases in the per capita cost of health care benefits (the health care cost trend rate) was 7.7% for all
claims and will gradually decrease each year thereafter to 5.1% in 2017 and beyond for our U.S. plan. A one-percentage point change in
the assumed health care cost trend rates for all postretirement plans would have the following effects:
1 Percentage
Point Increase
1 Percentage
Point Decrease
Effect on total of service and interest cost components $ .3 $ (.2)
Effect on postretirement benefit obligation 2.9 (2.5)
Postemployment Benefits
We provide postemployment benefits, which include salary continuation, severance benefits, disability benefits, continuation of health care
benefits and life insurance coverage to eligible former employees after employment but before retirement. The accrued cost for postemployment
benefits was $69.5 at December 31, 2011 and $67.1 at December 31, 2010, and was included in employee benefit plans liability.