Avon 2011 Annual Report Download - page 91
Download and view the complete annual report
Please find page 91 of the 2011 Avon annual report below. You can navigate through the pages in the report by either clicking on the pages listed below, or by using the keyword search tool below to find specific information within the annual report.-
 1
1 -
2
-
3
-
4
-
5
-
6
-
7
-
8
-
9
-
10
-
11
-
12
-
13
-
14
-
15
-
16
-
17
-
18
-
19
-
20
-
21
-
22
-
23
-
24
-
25
-
26
-
27
-
28
-
29
-
30
-
31
-
32
-
33
-
34
-
35
-
36
-
37
-
38
-
39
-
40
-
41
-
42
-
43
-
44
-
45
-
46
-
47
-
48
-
49
-
50
-
51
-
52
-
53
-
54
-
55
-
56
-
57
-
58
-
59
-
60
-
61
-
62
-
63
-
64
-
65
-
66
-
67
-
68
-
69
-
70
-
71
-
72
-
73
-
74
-
75
-
76
-
77
-
78
-
79
-
80
-
 81
81 -
 82
82 -
 83
83 -
 84
84 -
 85
85 -
 86
86 -
 87
87 -
 88
88 -
 89
89 -
 90
90 -
 91
91 -
 92
92 -
 93
93 -
 94
94 -
 95
95 -
 96
96 -
 97
97 -
 98
98 -
 99
99 -
 100
100 -
 101
101 -
102
-
103
-
104
-
105
-
106
-
107
-
108
 |
 |

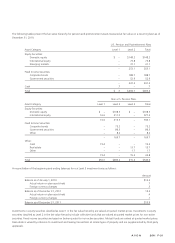
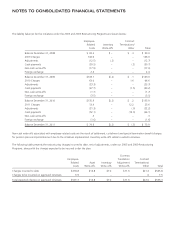
The following tables present the fair value hierarchy for pension and postretirement assets measured at fair value on a recurring basis as of
December 31, 2010:
U.S. Pension and Postretirement Plans
Asset Category Level 1 Level 2 Total
Equity Securities:
Domestic equity $ – $148.2 $148.2
International equity – 73.8 73.8
Emerging markets – 31.1 31.1
– 253.1 253.1
Fixed Income Securities:
Corporate bonds – 188.7 188.7
Government securities – 52.9 52.9
– 241.6 241.6
Cash .7 – .7
Total $ .7 $494.7 $495.4
Non-U.S. Pension Plans
Asset Category Level 1 Level 2 Level 3 Total
Equity Securities:
Domestic equity $ – $108.5 $ – $108.5
International equity 16.6 211.0 – 227.6
16.6 319.5 – 336.1
Fixed Income Securities:
Corporate bonds – 75.2 – 75.2
Government securities – 86.3 – 86.3
Other – 8.2 – 8.2
– 169.7 – 169.7
Other:
Cash 19.4 – – 19.4
Real estate – – 13.7 13.7
Other – – 1.7 1.7
19.4 – 15.4 34.8
Total $36.0 $489.2 $15.4 $540.6
A reconciliation of the beginning and ending balances for our Level 3 investments was as follows:
Amount
Balance as of January 1, 2010 $14.2
Actual return on plan assets held .7
Foreign currency changes .5
Balance as of December 31, 2010 15.4
Actual return on plan assets held .4
Foreign currency changes .1
Balance as of December 31, 2011 $15.9
Investments in equity securities classified as Level 1 in the fair value hierarchy are valued at quoted market prices. Investments in equity
securities classified as Level 2 in the fair value hierarchy include collective funds that are valued at quoted market prices for non-active
securities. Fixed income securities are based on broker quotes for non-active securities. Mutual funds are valued at quoted market prices.
Real estate is valued by reference to investment and leasing transactions at similar types of property and are supplemented by third party
appraisals.
A V O N 2011 F-31