Avon 2011 Annual Report Download - page 35
Download and view the complete annual report
Please find page 35 of the 2011 Avon annual report below. You can navigate through the pages in the report by either clicking on the pages listed below, or by using the keyword search tool below to find specific information within the annual report.-
 1
1 -
2
-
3
-
4
-
5
-
6
-
7
-
8
-
9
-
10
-
11
-
12
-
13
-
14
-
15
-
16
-
17
-
18
-
19
-
20
-
21
-
22
-
23
-
24
-
 25
25 -
 26
26 -
 27
27 -
 28
28 -
 29
29 -
 30
30 -
 31
31 -
 32
32 -
 33
33 -
 34
34 -
 35
35 -
 36
36 -
 37
37 -
 38
38 -
 39
39 -
 40
40 -
 41
41 -
 42
42 -
 43
43 -
 44
44 -
 45
45 -
46
-
47
-
48
-
49
-
50
-
51
-
52
-
53
-
54
-
55
-
56
-
57
-
58
-
59
-
60
-
61
-
62
-
63
-
64
-
65
-
66
-
67
-
68
-
69
-
70
-
71
-
72
-
73
-
74
-
75
-
76
-
77
-
78
-
79
-
80
-
81
-
82
-
83
-
84
-
85
-
86
-
87
-
88
-
89
-
90
-
91
-
92
-
93
-
94
-
95
-
96
-
97
-
98
-
99
-
100
-
101
-
102
-
103
-
104
-
105
-
106
-
107
-
108
 |
 |
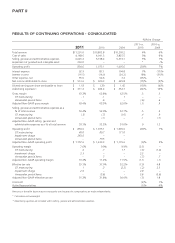
Total Revenue
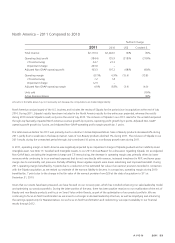
Total revenue in 2011 increased 4%, with favorable foreign exchange contributing 3 points to the revenue increase. Constant $ revenues
increased 1%. Active Representatives decreased 1%.
On a category basis, the increase in revenue during 2011 was primarily driven by an increase of 5% in Beauty sales, with increases in all
sub-categories of Beauty. Within the Beauty category, fragrance increased 7%, color cosmetics increased 5%, personal care increased 4%,
and skincare increased 3%. Fashion sales decreased 1% and Home sales increased 1%. On a Constant $ basis, the Beauty category
increased 2%. Within the Beauty category, on a Constant $ basis, sales of fragrance increased 5%, color cosmetics increased 2%, personal
care increased 1%, while skincare sales were flat. Constant $ sales of Fashion decreased 3%. We acquired Silpada at the end of July 2010.
Inclusion of Silpada’s results for July 2011 benefited the Fashion Constant $ growth rate by 5 points, as the similar period’s results were not
included in our 2010 financial results (“unmatched period”). Constant $ sales of Home decreased 2%.
As noted previously in our Overview section, our revenue performance, primarily in the latter part of 2011 was negatively impacted by
weaker macro-economic conditions. In Brazil, our largest market, lower than normal service levels were further impacted by the
implementation of an ERP system during the second half of the year, which weakened results. Additionally, slowing Beauty category market
growth pressured Brazil’s results in the second half of 2011. During the latter part of 2011, we believe Russia’s performance was also
impacted by weak trends in the Beauty category market in that country.
During 2010, total revenues increased 6% from 2009, favorably impacted by growth in Active Representatives. Constant $ revenues also
increased 6%. Acquisitions of Silpada in late July and Liz Earle in late March contributed approximately 1 point to revenue growth. Active
Representatives increased 4% in 2010.
On a category basis, the increase in revenue during 2010 was primarily driven by an increase of 6% in Beauty sales. Within the Beauty
category, fragrance increased 11%, color cosmetics increased 7%, personal care increased 5% and skincare declined 3%. Fashion sales
increased 11% and Home sales increased 3%. On a Constant $ basis, the Beauty category increased 6%. Within the Beauty category,
Constant $ sales of fragrance increased 12%, color cosmetics increased 6%, personal care increased 5% and skincare declined 3%. Skincare
growth rates benefited by 3 points from the Liz Earle acquisition. Constant $ sales of Fashion and Home increased 11% and 5%,
respectively. Fashion growth rates benefited by 6 points from the Silpada acquisition.
Strong revenue performance during the first half of 2010 was offset by a slowdown in revenue growth during the second half of the year.
Our second half of 2010 revenue growth was negatively impacted by a slowdown in two of our largest markets, Brazil and Russia. Brazil’s
moderated performance in the second half of 2010 was primarily caused by service disruptions resulting in shorting of products. The
mid-year implementation of government mandated e-invoicing exacerbated our legacy order processing systems and capacity which had
also been pressured by a significant increase in order scale in recent years. Russia’s performance in the second half of 2010 was primarily a
result of slowing field growth due to weak incentives. Increases in social benefit taxes levied against certain Representatives exacerbated the
slowdown in field growth. The increased taxes disproportionately reduced new and developing Representatives’ earnings, which reduced
their motivation to recruit. In Russia, weaker color and skincare performance negatively impacted growth in the second half of 2010.
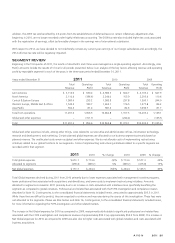
For additional discussion of the changes in revenue by segment, see the “Segment Review” section of this MD&A.
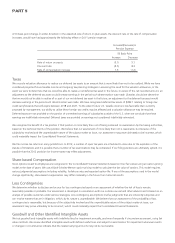
Gross Margin
Gross margin for 2011 increased by .5 points as compared to 2010, primarily due to the negative impact of the Venezuelan special items in
2010. On a Non-GAAP basis, excluding the impact of the CTI restructuring and the Venezuelan special items, gross margin decreased .1
points, as the negative impact of rising product costs was partially offset by pricing benefits and favorable foreign currency.
Gross margin for 2010 increased by .3 points as compared to 2009. On a Non-GAAP basis, excluding the impact of the CTI restructuring and
the Venezuelan special items, gross margin improved .9 points, reflecting benefits from manufacturing productivity gains, which include
benefits from the Strategic Sourcing Initiative (“SSI”), and the favorable impact of foreign exchange transactions. SSI was an initiative that
shifted our purchasing strategy towards a globally-coordinated one, which leveraged volumes.
A V O N 2011 27