Avon 2011 Annual Report Download - page 43
Download and view the complete annual report
Please find page 43 of the 2011 Avon annual report below. You can navigate through the pages in the report by either clicking on the pages listed below, or by using the keyword search tool below to find specific information within the annual report.-
 1
1 -
2
-
3
-
4
-
5
-
6
-
7
-
8
-
9
-
10
-
11
-
12
-
13
-
14
-
15
-
16
-
17
-
18
-
19
-
20
-
21
-
22
-
23
-
24
-
25
-
26
-
27
-
28
-
29
-
30
-
31
-
32
-
 33
33 -
 34
34 -
 35
35 -
 36
36 -
 37
37 -
 38
38 -
 39
39 -
 40
40 -
 41
41 -
 42
42 -
 43
43 -
 44
44 -
 45
45 -
 46
46 -
 47
47 -
 48
48 -
 49
49 -
 50
50 -
 51
51 -
 52
52 -
 53
53 -
54
-
55
-
56
-
57
-
58
-
59
-
60
-
61
-
62
-
63
-
64
-
65
-
66
-
67
-
68
-
69
-
70
-
71
-
72
-
73
-
74
-
75
-
76
-
77
-
78
-
79
-
80
-
81
-
82
-
83
-
84
-
85
-
86
-
87
-
88
-
89
-
90
-
91
-
92
-
93
-
94
-
95
-
96
-
97
-
98
-
99
-
100
-
101
-
102
-
103
-
104
-
105
-
106
-
107
-
108
 |
 |

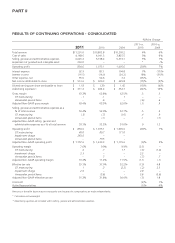
Total revenue during 2011 was flat primarily due to declines in Active Representatives as well as average order, due to macroeconomic
pressures in the region. These declines were offset by favorable foreign exchange. During 2011 revenue in Russia declined 1%. On a
Constant $ basis, revenue declined 4% in Russia for 2011 due to declines in average order as well as Active Representatives. During the
latter part of 2011, we believe Russia’s performance was also impacted by weak trends in the Beauty category market in that country.
On an Adjusted Non-GAAP basis, operating margin decreased in 2011 as improved gross margin was offset by higher distribution costs and
the unfavorable impact of lower revenues while continuing to incur overhead expenses that do not vary directly with revenue. Increased
investments in RVP was offset by lower advertising. RVP investment increased in 2011 in part to address the increased social benefit taxes
levied against certain Representatives beginning in 2010.
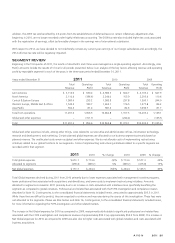
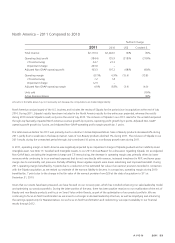
Central & Eastern Europe – 2010 Compared to 2009
%/Point Change
2010 2009 US$ Constant $
Total revenue $1,585.8 $1,500.1 6% 5%
Operating profit 297.8 244.9 22% 22%
CTI restructuring 4.7 29.7
Adjusted Non-GAAP operating profit 302.5 274.6 10% 12%
Operating margin 18.8% 16.3% 2.5 2.7
CTI restructuring .3 2.0
Adjusted Non-GAAP operating margin 19.1% 18.3% .8 1.1
Units sold 3%
Active Representatives 4%
Amounts in the table above may not necessarily sum because the computations are made independently.
Total revenue during 2010 increased compared to 2009 due to growth in Active Representatives and a higher average order, as well as
favorable foreign exchange. The region’s revenue benefited from growth of 11% in Russia, due partially to favorable foreign exchange.
During 2010, Constant $ revenue in Russia increased by 7% due to a growth in Active Representatives and a higher average order. Russia’s
revenue grew 26% in the first half of 2010, but was flat during the second half, with Constant $ growth rates of 14% in the first half and
2% in the second half. Russia’s performance in the second half of 2010 was primarily a result of slowing field growth due to weak
incentives. Increases in social benefit taxes levied against certain Representatives exacerbated the slowdown in field growth. The increased
taxes disproportionately reduced new and developing Representatives’ earnings, which reduced their motivation to recruit. In Russia, weaker
color and skincare performance negatively impacted revenue growth in the second half of 2010. During the first quarter of 2011, we
launched a new sales leadership compensation plan to help offset the tax burden on these Representatives.
During 2010, operating margin benefited by 1.7 points due to lower CTI restructuring compared to the prior year. On an Adjusted
Non-GAAP basis, the increase in operating margin during 2010 was primarily driven by the benefit of leverage from higher revenues with
fixed overhead expenses, partially offset by a lower gross margin.
A V O N 2011 35