Avon 2011 Annual Report Download - page 46
Download and view the complete annual report
Please find page 46 of the 2011 Avon annual report below. You can navigate through the pages in the report by either clicking on the pages listed below, or by using the keyword search tool below to find specific information within the annual report.-
 1
1 -
2
-
3
-
4
-
5
-
6
-
7
-
8
-
9
-
10
-
11
-
12
-
13
-
14
-
15
-
16
-
17
-
18
-
19
-
20
-
21
-
22
-
23
-
24
-
25
-
26
-
27
-
28
-
29
-
30
-
31
-
32
-
33
-
34
-
35
-
 36
36 -
 37
37 -
 38
38 -
 39
39 -
 40
40 -
 41
41 -
 42
42 -
 43
43 -
 44
44 -
 45
45 -
 46
46 -
 47
47 -
 48
48 -
 49
49 -
 50
50 -
 51
51 -
 52
52 -
 53
53 -
 54
54 -
 55
55 -
 56
56 -
57
-
58
-
59
-
60
-
61
-
62
-
63
-
64
-
65
-
66
-
67
-
68
-
69
-
70
-
71
-
72
-
73
-
74
-
75
-
76
-
77
-
78
-
79
-
80
-
81
-
82
-
83
-
84
-
85
-
86
-
87
-
88
-
89
-
90
-
91
-
92
-
93
-
94
-
95
-
96
-
97
-
98
-
99
-
100
-
101
-
102
-
103
-
104
-
105
-
106
-
107
-
108
 |
 |

PART II
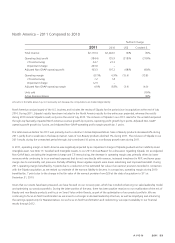
Asia Pacific – 2010 Compared to 2009
%/Point Change
2010 2009 US$ Constant $
Total revenue $981.4 $1,030.7 (5)% (10)%
Operating profit 82.6 81.7 1% (11)%
CTI restructuring (.3) 20.4
Adjusted Non-GAAP operating profit 82.3 102.1 (19)% (28)%
Operating margin 8.4% 7.9% .5 (.1)
CTI restructuring – 2.0
Adjusted Non-GAAP operating margin 8.4% 9.9% (1.5) (2.0)
Units sold (13)%
Active Representatives (7)%
Amounts in the table above may not necessarily sum because the computations are made independently.
Total revenue during 2010 decreased primarily due to a decrease in Active Representatives and lower average order, partially offset by
favorable foreign exchange. Revenue grew 15% during 2010 in the Philippines, benefiting partially from favorable foreign exchange.
Constant $ revenue during 2010 in the Philippines increased by 10% driven by growth in Active Representatives, which was supported by
RVP initiatives, offset by a lower average order. The region’s results were negatively impacted by a decline in skincare sales during 2010.
Revenue declined 35%, or 36% in Constant $, in China due to significant revenue declines in both direct-selling and Beauty Boutiques. The
fundamental challenges in our complex hybrid business model, including conflicting needs of retail and direct-selling, impacted both
businesses. Our continued transition away from our complex hybrid business model in China to one which focuses on direct selling and
updating our service center model includes a realigned field compensation structure and recalibrated merchandising and campaign
management strategies to support direct-selling.
During 2010, operating margin benefited by 2.0 points due to lower CTI restructuring compared to the prior year. This benefit was partially
offset by an unfavorable change in operating margin in China that was primarily driven by significantly lower revenues. On an Adjusted
Non-GAAP basis, excluding CTI restructuring, operating margin during 2010 declined due to the lower revenues in China. Partially offsetting
this decline was improved gross margin in other markets in the region, which benefited from lower product costs and favorable foreign
exchange, which benefited gross margin by approximately 1 point, partially offset by an increased investment in RVP.
Liquidity And Capital Resources
Our principal sources of funds historically have been cash flows from operations, commercial paper, borrowings under lines of credit, public
offerings of notes, and a private placement. As disclosed in the Latin America Segment Review, at December 31, 2011, we held cash
balances associated with our Venezuela operations denominated in Bolívares amounting to approximately $193 when translated at the
official exchange rate. Currency restrictions enacted by the Venezuelan government have impacted our ability to repatriate dividends and
royalties from our Venezuelan operations on a timely basis. We currently believe that existing cash outside of Venezuela, as well as cash to
be generated from operations outside of Venezuela along with available sources of public and private financing are adequate to meet the
Company’s anticipated requirements for general corporate needs. Substantially all of our cash and cash equivalents are held outside of the
U.S., as it relates to undistributed earnings of certain foreign subsidiaries, a portion of which we intend to reinvest indefinitely in our foreign
subsidiaries. If these indefinitely reinvested earnings were distributed to the U.S. parent as dividends, we may be subject to additional taxes.
With respect to 2012, we have decided to not indefinitely reinvest any current year earnings of our foreign subsidiaries.
We may, from time to time, seek to repurchase our equity or to retire our outstanding debt in open market purchases, privately negotiated
transactions, derivative instruments or otherwise. During 2011, we repurchased approximately .4 million shares of our common stock for an
aggregate purchase price of approximately $7.7. During 2010, we repurchased approximately .4 million shares of our common stock for an
aggregate purchase price of approximately $14.1.