Avon 2011 Annual Report Download - page 29
Download and view the complete annual report
Please find page 29 of the 2011 Avon annual report below. You can navigate through the pages in the report by either clicking on the pages listed below, or by using the keyword search tool below to find specific information within the annual report.-
 1
1 -
2
-
3
-
4
-
5
-
6
-
7
-
8
-
9
-
10
-
11
-
12
-
13
-
14
-
15
-
16
-
17
-
18
-
 19
19 -
 20
20 -
 21
21 -
 22
22 -
 23
23 -
 24
24 -
 25
25 -
 26
26 -
 27
27 -
 28
28 -
 29
29 -
 30
30 -
 31
31 -
 32
32 -
 33
33 -
 34
34 -
 35
35 -
 36
36 -
 37
37 -
 38
38 -
 39
39 -
40
-
41
-
42
-
43
-
44
-
45
-
46
-
47
-
48
-
49
-
50
-
51
-
52
-
53
-
54
-
55
-
56
-
57
-
58
-
59
-
60
-
61
-
62
-
63
-
64
-
65
-
66
-
67
-
68
-
69
-
70
-
71
-
72
-
73
-
74
-
75
-
76
-
77
-
78
-
79
-
80
-
81
-
82
-
83
-
84
-
85
-
86
-
87
-
88
-
89
-
90
-
91
-
92
-
93
-
94
-
95
-
96
-
97
-
98
-
99
-
100
-
101
-
102
-
103
-
104
-
105
-
106
-
107
-
108
 |
 |

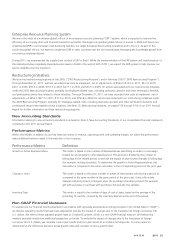
Enterprise Resource Planning System
We are in the midst of a multi-year global roll-out of an enterprise resource planning (“ERP”) system, which is expected to improve the
efficiency of our supply chain and financial transaction processes. We began our gradual global roll-out in Europe in 2005 and have since
implemented ERP in our European manufacturing facilities, our larger European direct selling operations and in the U.S. As part of this
continuing global roll-out, we expect to implement ERP in other countries over the next several years leveraging the knowledge gained from
our previous implementations.
During 2011, we implemented the supply chain module of ERP in Brazil. While the implementation of the ERP system and transformation of
the related processes negatively impacted service levels in Brazil in the second half of 2011, we expect the ERP system to help improve our
service reliability over the long-term.
Restructuring Initiatives
We launched restructuring programs in late 2005 (“2005 Restructuring Program”) and in February 2009 (“2009 Restructuring Program”).
Through December 31, 2011, we have recorded total costs to implement, net of adjustments, of $526.0 ($12.3 in 2011, $3.2 in 2010,
$20.1 in 2009, $59.3 in 2008, $157.5 in 2007, $217.1 in 2006 and $56.5 in 2005) for actions associated with our restructuring initiatives
under the 2005 Restructuring Program, primarily for employee-related costs, including severance, pension and other termination benefits,
and professional service fees related to these initiatives. Through December 31, 2011, we have recorded total costs to implement, net of
adjustments, of $256.0 ($27.7 in 2011, $77.5 in 2010, and $150.8 in 2009) for actions associated with our restructuring initiatives under
the 2009 Restructuring Program, primarily for employee-related costs, including severance, pension and other termination benefits, and
professional service fees related to these initiatives. See Note 15, Restructuring Initiatives, on pages F-36 through F-39 of our 2011 Annual
Report for further information on these restructuring programs.
New Accounting Standards
Information relating to new accounting standards is included in Note 2, New Accounting Standards, of our consolidated financial statements
contained in this 2011 Annual Report.
Performance Metrics
Within this MD&A, in addition to our key financial metrics of revenue, operating profit and operating margin, we utilize the performance
metrics defined below to assist in the evaluation of our business.
Performance Metrics Definition
Growth in Active Representatives This metric is based on the number of Representatives submitting an order in a campaign,
totaled for all campaigns in the related period. This amount is divided by the number of
billing days in the related period, to exclude the impact of year-to-year changes in billing days
(for example, holiday schedules). To determine the growth in Active Representatives, this
calculation is compared to the same calculation in the corresponding period of the prior year.
Change in Units This metric is based on the gross number of pieces of merchandise sold during a period, as
compared to the same number in the same period of the prior year. Units sold include
samples sold and product contingent upon the purchase of another product (for example,
gift with purchase or purchase with purchase), but exclude free samples.
Inventory Days This metric is equal to the number of days of cost of sales, based on the average of the
preceding 12 months, covered by the inventory balance at the end of the period.
Non-GAAP Financial Measures
To supplement our financial results presented in accordance with generally accepted accounting principles in the United States (“GAAP”),
we disclose operating results that have been adjusted to exclude the impact of changes due to the translation of foreign currencies into
U.S. dollars. We refer to these adjusted growth rates as Constant $ growth, which is a non-GAAP financial measure. We believe this
measure provides investors an additional perspective on trends. To exclude the impact of changes due to the translation of foreign
currencies into U.S. dollars, we calculate current year results and prior year results at a constant exchange rate. Currency impact is
determined as the difference between actual growth rates and constant currency growth rates.
A V O N 2011 21