Avon 2011 Annual Report Download - page 38
Download and view the complete annual report
Please find page 38 of the 2011 Avon annual report below. You can navigate through the pages in the report by either clicking on the pages listed below, or by using the keyword search tool below to find specific information within the annual report.-
 1
1 -
2
-
3
-
4
-
5
-
6
-
7
-
8
-
9
-
10
-
11
-
12
-
13
-
14
-
15
-
16
-
17
-
18
-
19
-
20
-
21
-
22
-
23
-
24
-
25
-
26
-
27
-
 28
28 -
 29
29 -
 30
30 -
 31
31 -
 32
32 -
 33
33 -
 34
34 -
 35
35 -
 36
36 -
 37
37 -
 38
38 -
 39
39 -
 40
40 -
 41
41 -
 42
42 -
 43
43 -
 44
44 -
 45
45 -
 46
46 -
 47
47 -
 48
48 -
49
-
50
-
51
-
52
-
53
-
54
-
55
-
56
-
57
-
58
-
59
-
60
-
61
-
62
-
63
-
64
-
65
-
66
-
67
-
68
-
69
-
70
-
71
-
72
-
73
-
74
-
75
-
76
-
77
-
78
-
79
-
80
-
81
-
82
-
83
-
84
-
85
-
86
-
87
-
88
-
89
-
90
-
91
-
92
-
93
-
94
-
95
-
96
-
97
-
98
-
99
-
100
-
101
-
102
-
103
-
104
-
105
-
106
-
107
-
108
 |
 |

PART II
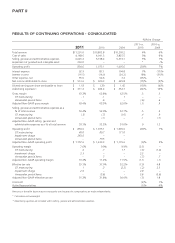
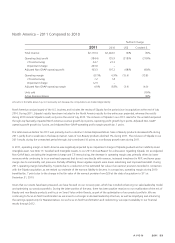
Latin America – 2011 Compared to 2010
%/Point Change
2011 2010 US$ Constant $
Total revenue $5,116.0 $4,589.5 11% 8%
Operating profit 630.4 604.7 4% (12)%
CTI restructuring 3.1 19.8
Venezuelan special items – 79.5
Adjusted Non-GAAP operating profit 633.5 704.0 (10)% (14)%
Operating margin 12.3% 13.2% (0.9) (2.8)
CTI restructuring .1 .4
Venezuelan special items –1.7
Adjusted Non-GAAP operating margin 12.4% 15.3% (2.9) (3.1)
Units sold 2%
Active Representatives 3%
Amounts in the table above may not necessarily sum because the computations are made independently.
Total revenue during 2011 increased due to higher average order and growth in Active Representatives, as well as due to favorable foreign
exchange. Average order benefited from the favorable impacts of pricing while Active Representatives growth benefited from continued
investments in RVP. Revenue during 2011 grew 6% in Brazil and 17% in Mexico, with benefits from favorable foreign exchange. Constant $
revenue during 2011 benefited from continued growth in most markets, particularly from growth of 14% in Mexico. Constant $ revenue in
Brazil was relatively flat. In Venezuela, revenue and Constant $ revenue during 2011 grew 28%. Additional information regarding our
Venezuela operations is discussed in more detail below.
Brazil’s performance during 2011 continued to be pressured by lower than normal service levels. In addition, lower than normal service levels
were further impacted by the implementation of an ERP system during the second half of the year, which in turn has negatively impacted
average order, Active Representatives, and revenue growth. Additionally, slowing Beauty category market growth pressured Brazil’s results in
the second half of 2011. While the implementation of the ERP system and transformation of the related processes may negatively impact
service levels in the short-term, we expect the ERP system to help improve our service reliability over the long-term.
Constant $ revenue growth in Mexico during 2011, was driven by an increase in Active Representatives and a higher average order. Revenue
growth during 2011 in Venezuela was the result of a higher average order primarily due to increased prices, primarily as a result of inflation.
The decrease in Adjusted Non-GAAP operating margin during 2011 was driven by a sharp decline in Brazil’s operating margin. Brazil’s 2011
operating margin was partially unfavorably impacted by inventory related charges primarily due to supply chain challenges, which negatively
impacted Latin America’s operating margin by .3 points. Additionally, Brazil’s decline in operating margin was further caused by business
disruptions and resulting investments in that market, as well as inflationary pressure on costs. Adjusted Non-GAAP operating margin in the
region during 2011 was also negatively impacted by higher bad debt expense and higher distribution costs due to the transition to the new
facilities in Brazil and Colombia. Operating margin during 2010, in Latin America was negatively impacted by the devaluation of the
Venezuelan currency in conjunction with higher inflationary accounting as discussed further below.
Effective January 1, 2010, we began to account for Venezuela as a highly inflationary economy. Effective January 11, 2010, the Venezuelan
government devalued its currency and moved to a two-tier exchange structure. The official exchange rate moved from 2.15 to 2.60 for
essential goods and to 4.30 for nonessential goods and services. Effective December 30, 2010, the Venezuelan government eliminated the
2.60 rate which had been available for the import of essential goods. Substantially all of the imports of our subsidiary in Venezuela (“Avon
Venezuela”) fall into the nonessential classification.