Avon 2011 Annual Report Download - page 28
Download and view the complete annual report
Please find page 28 of the 2011 Avon annual report below. You can navigate through the pages in the report by either clicking on the pages listed below, or by using the keyword search tool below to find specific information within the annual report.-
 1
1 -
2
-
3
-
4
-
5
-
6
-
7
-
8
-
9
-
10
-
11
-
12
-
13
-
14
-
15
-
16
-
17
-
 18
18 -
 19
19 -
 20
20 -
 21
21 -
 22
22 -
 23
23 -
 24
24 -
 25
25 -
 26
26 -
 27
27 -
 28
28 -
 29
29 -
 30
30 -
 31
31 -
 32
32 -
 33
33 -
 34
34 -
 35
35 -
 36
36 -
 37
37 -
 38
38 -
39
-
40
-
41
-
42
-
43
-
44
-
45
-
46
-
47
-
48
-
49
-
50
-
51
-
52
-
53
-
54
-
55
-
56
-
57
-
58
-
59
-
60
-
61
-
62
-
63
-
64
-
65
-
66
-
67
-
68
-
69
-
70
-
71
-
72
-
73
-
74
-
75
-
76
-
77
-
78
-
79
-
80
-
81
-
82
-
83
-
84
-
85
-
86
-
87
-
88
-
89
-
90
-
91
-
92
-
93
-
94
-
95
-
96
-
97
-
98
-
99
-
100
-
101
-
102
-
103
-
104
-
105
-
106
-
107
-
108
 |
 |
PART II
During 2011, our operating margin was negatively impacted by an impairment charge of goodwill and an indefinite-lived intangible asset
associated with our Silpada business unit which we acquired during 2010. As a result of this impairment charge, operating profit for 2011
was negatively impacted by $263.0. Please refer to Note 17, Goodwill and Intangible Assets, of our 2011 Annual Report for a discussion
regarding Silpada.
We continue to experience increases in labor and commodity costs, including oil, silver and cotton. Our pricing strategies are helping to
partially offset the resulting product cost increases but there is no assurance that we will be able to pass on product cost increases fully or
immediately.
In 2011, we committed to undertake a detailed assessment of our long-range business plan in order to improve our performance and better
position ourselves in the increasingly complex economic environment. The review will include internal and external inputs, executional
capabilities and capital allocation.
We believe that our operating cash flow and global cash and cash equivalent balances will allow us to continue our focus on long-term
sustainable, profitable growth. We are also focused on innovating our direct selling channel through technological and service model
enhancements for our Representatives.
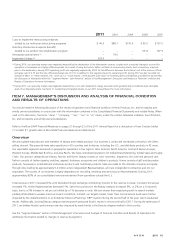
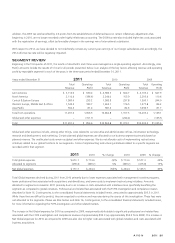
Beginning in the first quarter of 2011, the results of Asia Pacific and China were managed as a single operating segment, referred to as Asia
Pacific. Accordingly, Asia Pacific amounts include the results of China for all periods presented. In December 2010, we completed the sale of
our subsidiary in Japan, which has been reflected as discontinued operations for all periods.
Initiatives
We continue to implement certain initiatives under our 2005 and 2009 restructuring programs. The anticipated savings or benefits realized
from these initiatives has funded and will continue to fund our investment in, amongst other things, advertising, market intelligence,
consumer research and product innovation.
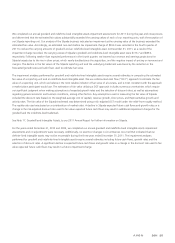
Advertising and Representative Value Proposition (“RVP”)
We significantly increased spending on advertising over the four years leading up to 2011. While investing in advertising remains a key
strategy, during 2011 our investment in advertising decreased by $89.2 or 22% and as a percentage of Beauty sales, our investment in
advertising decreased by 24% compared to 2010. The decrease in advertising in 2011 is primarily due to the shift to increased investment
in RVP. The advertising investments supported new product launches, such as SuperShock Max Mascara. Moisture Seduction Lipstick,
Outspoken Intense by Fergie Fragrance, Step Into Fragrance, Anew Genics Treatment Cream, Anew Solar Advance Sunscreen Face Lotion
SPF 45, Solutions Youth Minerals Restorative Night Cream, Super Enchant Mascara, and ExtraLasting Makeup. Advertising investments also
included advertising to recruit Representatives. We also continued to build the alliances portfolio including Fergie and local celebrities in
Latin America and Russia.
We continued to invest in our direct-selling channel to improve the reward and effort equation for our Representatives. We have committed
significant investments for extensive research to determine the payback on advertising and field tools and actions, and the optimal balance
of these tools and actions in our markets. We have allocated these significant investments in proprietary direct selling analytics to better
understand the drivers of value for our Representatives. We measure our investment in RVP as the incremental cost to provide these value-
enhancing initiatives. During 2011, we invested approximately $121.0 incrementally in our Representatives through RVP by continued
implementation of our Sales Leadership program, enhanced incentives, increased sales campaign frequency, improved commissions and new
e-business tools. We will continue to look for ways to improve the earnings opportunity for Representatives through various means,
including the following:
• Evaluating optimum discount structures in select markets;
• Continuing the roll-out of our Sales Leadership Program, which offers Representatives an enhanced career opportunity;
• Strategically examining the fee structure and brochure costs to enhance Representative economics;
• Recalibrating the frequency of campaigns to maximize Representative selling opportunities;
• Service Model Transformation initiatives;
• Applying the optimal balance of advertising and field investment in our key markets; and
• Web enablement for Representatives including on-line training enhancements.
While the reward and effort will be different within our global portfolio of businesses, we believe that web enablement is a key element to
reduce Representative effort worldwide. We will continue to focus on improving Internet-based tools for our Representatives.