Avon 2011 Annual Report Download - page 104
Download and view the complete annual report
Please find page 104 of the 2011 Avon annual report below. You can navigate through the pages in the report by either clicking on the pages listed below, or by using the keyword search tool below to find specific information within the annual report.-
 1
1 -
2
-
3
-
4
-
5
-
6
-
7
-
8
-
9
-
10
-
11
-
12
-
13
-
14
-
15
-
16
-
17
-
18
-
19
-
20
-
21
-
22
-
23
-
24
-
25
-
26
-
27
-
28
-
29
-
30
-
31
-
32
-
33
-
34
-
35
-
36
-
37
-
38
-
39
-
40
-
41
-
42
-
43
-
44
-
45
-
46
-
47
-
48
-
49
-
50
-
51
-
52
-
53
-
54
-
55
-
56
-
57
-
58
-
59
-
60
-
61
-
62
-
63
-
64
-
65
-
66
-
67
-
68
-
69
-
70
-
71
-
72
-
73
-
74
-
75
-
76
-
77
-
78
-
79
-
80
-
81
-
82
-
83
-
84
-
85
-
86
-
87
-
88
-
89
-
90
-
91
-
92
-
93
-
 94
94 -
 95
95 -
 96
96 -
 97
97 -
 98
98 -
 99
99 -
 100
100 -
 101
101 -
 102
102 -
 103
103 -
 104
104 -
 105
105 -
 106
106 -
 107
107 -
 108
108
 |
 |

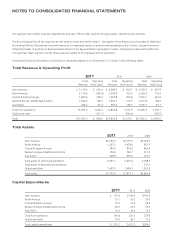
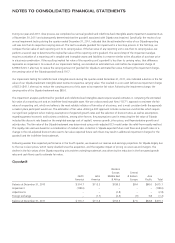
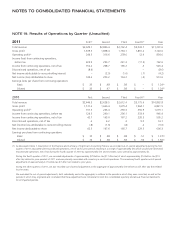
NOTES TO CONSOLIDATED FINANCIAL STATEMENTS
NOTE 19. Results of Operations by Quarter (Unaudited)
2011 First(1) Second Third Fourth(1) Year
Total revenue $2,629.1 $2,856.4 $2,762.4 $3,043.7 $11,291.6
Gross profit 1,679.3 1,838.4 1,764.1 1,861.2 7,143.0
Operating profit(2) 246.5 316.6 278.6 12.9 854.6
Income (loss) from continuing operations,
before tax 224.9 293.7 241.3 (17.3) 742.6
Income from continuing operations, net of tax 152.2 208.7 165.2 .3 526.4
Discontinued operations, net of tax (8.6) – – – (8.6)
Net income attributable to noncontrolling interest – (2.5) (1.0) (.7) (4.2)
Net income (loss) attributable to Avon 143.6 206.2 164.2 (.4) 513.6
Earnings (loss) per share from continuing operations
Basic $ .35 $ .48 $ .38 $ – $ 1.20(3)
Diluted $ .35 $ .47 $ .38 $ – $ 1.20(3)
2010 First Second Third Fourth(1) Year
Total revenue $2,446.3 $2,628.5 $2,612.4 $3,175.6 $10,862.8
Gross profit 1,511.6 1,666.4 1,679.4 1,964.1 6,821.5
Operating profit(2) 191.5 266.4 259.3 355.9 1,073.1
Income from continuing operations, before tax 126.3 249.1 236.1 333.9 945.4
Income from continuing operations, net of tax 42.7 165.0 167.2 220.3 595.2
Discontinued operations, net of tax .6 4.2 .3 9.0 14.1
Net (income) loss attributable to noncontrolling interest (.8) (1.6) (.8) .2 (3.0)
Net income attributable to Avon 42.5 167.6 166.7 229.5 606.3
Earnings per share from continuing operations
Basic $ .10 $ .38 $ .38 $ .51 $ 1.37(3)
Diluted $ .10 $ .38 $ .38 $ .50 $ 1.36(3)
(1) As discussed in Note 1, Description of the Business and Summary of Significant Accounting Policies, we recorded out-of- period adjustments during the first
quarter of 2011 associated with Discontinued operations, net of tax for prior periods resulting in a charge of approximately $9, which would have decreased
Discontinued operations, net of tax during the fourth quarter of 2010 by approximately $13 and increased a prior period by approximately $4.
During the fourth quarter of 2011, we recorded adjustments of approximately $25 before tax ($17 after tax) of which approximately $14 before tax ($10
after tax) related to prior quarters of 2011 and was primarily associated with inventory in our Brazil operations. The remaining fourth quarter out-of-period
adjustments of approximately $11 before tax ($7 after tax) related to prior years.
During the other quarters of 2011, we also recorded out-of-period adjustments in the aggregate of approximately $10 before tax ($7 after tax) that related
to prior years.
We evaluated the out-of-period adjustments, both individually and in the aggregate, in relation to the periods in which they were corrected, as well as the
periods in which they originated and concluded that these adjustments are immaterial to both the consolidated quarterly and annual financial statements
for all impacted periods.