Avon 2011 Annual Report Download - page 42
Download and view the complete annual report
Please find page 42 of the 2011 Avon annual report below. You can navigate through the pages in the report by either clicking on the pages listed below, or by using the keyword search tool below to find specific information within the annual report.-
 1
1 -
2
-
3
-
4
-
5
-
6
-
7
-
8
-
9
-
10
-
11
-
12
-
13
-
14
-
15
-
16
-
17
-
18
-
19
-
20
-
21
-
22
-
23
-
24
-
25
-
26
-
27
-
28
-
29
-
30
-
31
-
 32
32 -
 33
33 -
 34
34 -
 35
35 -
 36
36 -
 37
37 -
 38
38 -
 39
39 -
 40
40 -
 41
41 -
 42
42 -
 43
43 -
 44
44 -
 45
45 -
 46
46 -
 47
47 -
 48
48 -
 49
49 -
 50
50 -
 51
51 -
 52
52 -
53
-
54
-
55
-
56
-
57
-
58
-
59
-
60
-
61
-
62
-
63
-
64
-
65
-
66
-
67
-
68
-
69
-
70
-
71
-
72
-
73
-
74
-
75
-
76
-
77
-
78
-
79
-
80
-
81
-
82
-
83
-
84
-
85
-
86
-
87
-
88
-
89
-
90
-
91
-
92
-
93
-
94
-
95
-
96
-
97
-
98
-
99
-
100
-
101
-
102
-
103
-
104
-
105
-
106
-
107
-
108
 |
 |

PART II
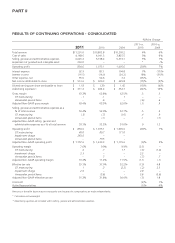
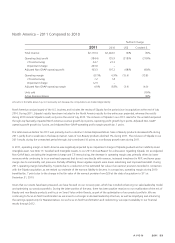
North America – 2010 Compared to 2009
%/Point Change
2010 2009 US$ Constant $
Total revenue $2,244.0 $2,293.4 (2)% (3)%
Operating profit 155.9 110.4 41% 37%
CTI restructuring 41.3 40.5
Adjusted Non-GAAP operating profit 197.2 150.9 31% 28%
Operating margin 6.9% 4.8% 2.1 2.0
CTI restructuring 1.8 1.8
Adjusted Non-GAAP operating margin 8.8% 6.6% 2.2 2.1
Units sold (7)%
Active Representatives (3)%
Amounts in the table above may not necessarily sum because the computations are made independently.
The inclusion of Silpada’s results during the latter portion of 2010 favorably impacted North America revenue growth by 5 points during
2010 as compared to 2009. Silpada also favorably impacted operating profit growth by 31 points during 2010 and favorably impacted
Adjusted Non-GAAP operating profit growth by 23 points. As a result of the Silpada acquisition, units sold and Active Representatives for
2010 were each favorably impacted by 1 point.
The total revenue decline during 2010 was due to a decline in Active Representatives and a lower average order received from
Representatives. The decline in Active Representatives for 2010 was largely due to a decline in additions compared with 2009’s record
recruiting. This resulted in strong growth in Active Representatives during 2009 causing an unfavorable comparison in 2010. Sales of
non-Beauty products decreased 1% during 2010, with Silpada offsetting the decline by 10 points. Sales of Beauty products decreased 4%
during 2010, partly due to weakness in the beauty market.
The increase in North America operating margin and Adjusted Non-GAAP operating margin during 2010 was primarily driven by
improvements in gross margin caused by favorable pricing and mix and manufacturing productivity gains and the inclusion of Silpada results,
which benefited operating margin by 1.2 points during 2010, despite approximately $7 of amortization of intangible assets. These operating
margin benefits were negatively impacted by lower revenues which were not able to offset overhead expenses, despite cost saving
initiatives. The costs associated with completing the Silpada acquisition were recorded in global expenses and were not allocated to the
North America segment. Included within the Silpada results was an operating margin benefit of .7 points due to a change in the estimated
fair value of an earnout provision recorded in connection with the Silpada acquisition.
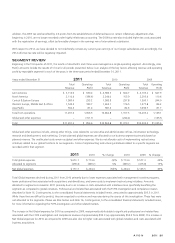
Central & Eastern Europe – 2011 Compared to 2010
%/Point Change
2011 2010 US$ Constant $
Total revenue $1,580.6 $1,585.8 –% (4)%
Operating profit 295.2 297.8 (1)% (5)%
CTI restructuring 2.5 4.7
Adjusted Non-GAAP operating profit 297.7 302.5 (2)% (6)%
Operating margin 18.7% 18.8% (.1) (.3)
CTI restructuring .2 .3
Adjusted Non-GAAP operating margin 18.8% 19.1% (.3) (.4)
Units sold (6)%
Active Representatives (2)%
Amounts in the table above may not necessarily sum because the computations are made independently.