Avon 2011 Annual Report Download - page 27
Download and view the complete annual report
Please find page 27 of the 2011 Avon annual report below. You can navigate through the pages in the report by either clicking on the pages listed below, or by using the keyword search tool below to find specific information within the annual report.-
 1
1 -
2
-
3
-
4
-
5
-
6
-
7
-
8
-
9
-
10
-
11
-
12
-
13
-
14
-
15
-
16
-
 17
17 -
 18
18 -
 19
19 -
 20
20 -
 21
21 -
 22
22 -
 23
23 -
 24
24 -
 25
25 -
 26
26 -
 27
27 -
 28
28 -
 29
29 -
 30
30 -
 31
31 -
 32
32 -
 33
33 -
 34
34 -
 35
35 -
 36
36 -
 37
37 -
38
-
39
-
40
-
41
-
42
-
43
-
44
-
45
-
46
-
47
-
48
-
49
-
50
-
51
-
52
-
53
-
54
-
55
-
56
-
57
-
58
-
59
-
60
-
61
-
62
-
63
-
64
-
65
-
66
-
67
-
68
-
69
-
70
-
71
-
72
-
73
-
74
-
75
-
76
-
77
-
78
-
79
-
80
-
81
-
82
-
83
-
84
-
85
-
86
-
87
-
88
-
89
-
90
-
91
-
92
-
93
-
94
-
95
-
96
-
97
-
98
-
99
-
100
-
101
-
102
-
103
-
104
-
105
-
106
-
107
-
108
 |
 |

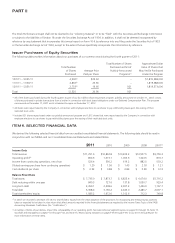
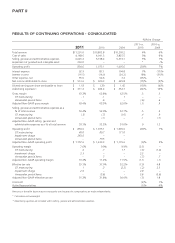
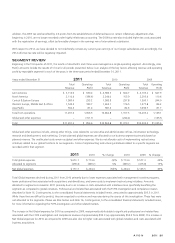
2011 2010 2009 2008 2007
Costs to implement restructuring initiatives
related to our multi-year restructuring programs $ 40.0 $80.7 $170.9 $ 59.3 $157.5
Inventory obsolescence expense (benefit)
related to our product line simplification program – – – (13.0) 167.3
Venezuelan special items (3) – 79.5 – – –
Impairment charge (4) 263.0 – – – –
(3) During 2010, our operating margin was negatively impacted by the devaluation of the Venezuelan currency coupled with a required change to account for
operations in Venezuela on a highly inflationary basis. As a result of using the historic dollar cost basis of nonmonetary assets, such as inventory, acquired
prior to the devaluation, during 2010 operating profit was negatively impacted by $79.5 for the difference between the historical cost at the previous official
exchange rate of 2.15 and the new official exchange rate of 4.30. In addition to the negative impact to operating profit, during 2010 we also recorded net
charges of $46.1 in “Other expense, net” and $12.7 in “income taxes”, reflecting the write-down of monetary assets and liabilities and deferred tax benefits.
See discussion of Venezuela within the “Segment Review - Latin America” section of this Management’s Discussion and Analysis of Financial Condition and
Results of Operations for more information.
(4) During 2011, our operating margin was negatively impacted by a non-cash impairment charge associated with goodwill and an indefinite-lived intangible
asset of our Silpada business. See Note 17, Goodwill and Intangible Assets, to our 2011 Annual Report for more information.
ITEM 7. MANAGEMENT’S DISCUSSION AND ANALYSIS OF FINANCIAL CONDITION
AND RESULTS OF OPERATIONS
You should read the following discussion of the results of operations and financial condition of Avon Products, Inc. and its majority and
wholly owned subsidiaries in conjunction with the information contained in the Consolidated Financial Statements and related Notes. When
used in this discussion, the terms “Avon,” “Company,” “we,” “our” or “us” mean, unless the context otherwise indicates, Avon Products,
Inc. and its majority and wholly owned subsidiaries.
Refer to the Non-GAAP Financial Measures on pages 21 through 22 of this 2011 Annual Report for a description of how Constant dollar
(“Constant $”) growth rates (a Non-GAAP financial measure) are determined.
Overview
We are a global manufacturer and marketer of beauty and related products. Our business is conducted worldwide, primarily in the direct
selling channel. We presently have sales operations in 65 countries and territories, including the U.S., and distribute products in 42 more.
Our reportable segments are based on geographic operations in five regions: Latin America; North America; Central & Eastern Europe;
Western Europe, Middle East & Africa; and Asia Pacific. We have centralized operations for Global Brand Marketing, Global Sales and Supply
Chain. Our product categories are Beauty, Fashion and Home. Beauty consists of color cosmetics, fragrances, skin care and personal care.
Fashion consists of fashion jewelry, watches, apparel, footwear, accessories and children’s products. Home consists of gift and decorative
products, housewares, entertainment and leisure products and nutritional products. Sales are made to the ultimate consumer principally
through direct selling by approximately 6.4 million active independent Representatives, who are independent contractors and not our
employees. The success of our business is highly dependent on recruiting, retaining and servicing our Representatives. During 2011,
approximately 83% of our consolidated revenue was derived from operations outside the U.S.
Total revenue in 2011 increased 4%, with favorable foreign exchange contributing 3 points to the revenue increase. Constant $ revenues
increased 1%. Active Representatives decreased 1%. Sales from products in the Beauty category increased 5%, or 2% on a Constant $
basis, due to a 3% increase in net per unit offset by a 1% decrease in units. We saw slower than expected growth in several markets
partially attributable to weaker macro-economic conditions. In Brazil, our largest market, lower than normal service levels were further
impacted by the implementation of an Enterprise Resource Planning (“ERP”) system during the second half of the year, which weakened
results. Additionally, slowing Beauty category market growth pressured Brazil’s results in the second half of 2011. During the latter part of
2011, we believe Russia’s performance was also impacted by weak trends in the Beauty category market in that country.
See the “Segment Review” section of this Management’s Discussion and Analysis of Financial Condition and Results of Operations for
additional information related to changes in revenue by segment.
A V O N 2011 19