Avon 2011 Annual Report Download - page 83
Download and view the complete annual report
Please find page 83 of the 2011 Avon annual report below. You can navigate through the pages in the report by either clicking on the pages listed below, or by using the keyword search tool below to find specific information within the annual report.-
 1
1 -
2
-
3
-
4
-
5
-
6
-
7
-
8
-
9
-
10
-
11
-
12
-
13
-
14
-
15
-
16
-
17
-
18
-
19
-
20
-
21
-
22
-
23
-
24
-
25
-
26
-
27
-
28
-
29
-
30
-
31
-
32
-
33
-
34
-
35
-
36
-
37
-
38
-
39
-
40
-
41
-
42
-
43
-
44
-
45
-
46
-
47
-
48
-
49
-
50
-
51
-
52
-
53
-
54
-
55
-
56
-
57
-
58
-
59
-
60
-
61
-
62
-
63
-
64
-
65
-
66
-
67
-
68
-
69
-
70
-
71
-
72
-
 73
73 -
 74
74 -
 75
75 -
 76
76 -
 77
77 -
 78
78 -
 79
79 -
 80
80 -
 81
81 -
 82
82 -
 83
83 -
 84
84 -
 85
85 -
 86
86 -
 87
87 -
 88
88 -
 89
89 -
 90
90 -
 91
91 -
 92
92 -
 93
93 -
94
-
95
-
96
-
97
-
98
-
99
-
100
-
101
-
102
-
103
-
104
-
105
-
106
-
107
-
108
 |
 |

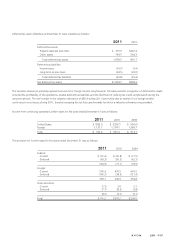
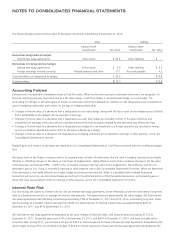
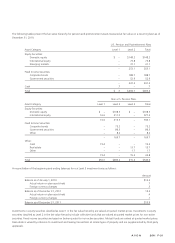
The following table presents the fair value hierarchy for those assets and liabilities measured at fair value on a recurring basis as of
December 31, 2010:
Level 1 Level 2 Total
Assets:
Available-for-sale securities $1.8 $ – $ 1.8
Interest-rate swap agreements – 103.9 103.9
Foreign exchange forward contracts – 11.1 11.1
Total $1.8 $115.0 $116.8
Liabilities:
Interest-rate swap agreements $ – $ 9.5 $ 9.5
Foreign exchange forward contracts – 4.3 4.3
Total $ – $ 13.8 $ 13.8
The table above excludes our pension and postretirement plan assets. Refer to Note 12, Employee Benefit Plans, for the fair value hierarchy
for our plan assets. The available-for-sale securities include securities held in a trust in order to fund future benefit payments for
non-qualified retirement plans (see Note 12, Employee Benefit Plans). The foreign exchange forward contracts and interest-rate swap
agreements are hedges of either recorded assets or liabilities or anticipated transactions. The underlying hedged assets and liabilities or
anticipated transactions are not reflected in the table above.
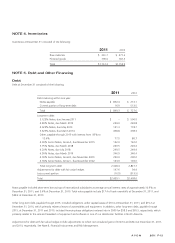
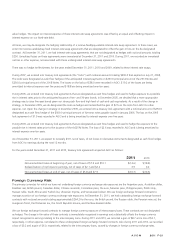
Fair Value of Financial Instruments
The net asset (liability) amounts recorded in the balance sheet (carrying amount) and the estimated fair values of financial instruments at
December 31 consisted of the following:
2011 2010
Carrying
Amount
Fair
Value
Carrying
Amount
Fair
Value
Cash and cash equivalents $1,245.1 $1,245.1 $1,179.9 $1,179.9
Available-for-sale securities 1.8 1.8 1.8 1.8
Grantor trust cash and cash equivalents 0.7 0.7 1.4 1.4
Short term investments 18.0 18.0 17.1 17.1
Debt maturing within one year 849.3 849.3 727.6 727.6
Long-term debt, net of related discount or premium 2,459.1 2,445.2 2,408.6 2,502.4
Foreign exchange forward contracts (4.9) (4.9) 6.8 6.8
Interest-rate swap agreements 147.6 147.6 94.4 94.4
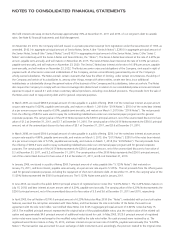
The methods and assumptions used to estimate fair value are as follows:
Cash and cash equivalents, Grantor trust cash and cash equivalents and Short term investments – Given the short term nature of these
financial instruments, the stated cost approximates fair value.
Available-for-sale securities – The fair values of these investments were based on the quoted market prices for issues listed on securities
exchanges.
Debt maturing within one year and long-term debt – The fair values of all debt and other financing were determined based on quoted
market prices.
Foreign exchange forward contracts – The fair values of forward contracts were estimated based on quoted forward foreign exchange prices
at the reporting date.
Interest-rate swap agreements – The fair values of interest-rate swap agreements were estimated based LIBOR yield curves at the reporting
date.
A V O N 2011 F-23