Avon 2011 Annual Report Download - page 36
Download and view the complete annual report
Please find page 36 of the 2011 Avon annual report below. You can navigate through the pages in the report by either clicking on the pages listed below, or by using the keyword search tool below to find specific information within the annual report.-
 1
1 -
2
-
3
-
4
-
5
-
6
-
7
-
8
-
9
-
10
-
11
-
12
-
13
-
14
-
15
-
16
-
17
-
18
-
19
-
20
-
21
-
22
-
23
-
24
-
25
-
 26
26 -
 27
27 -
 28
28 -
 29
29 -
 30
30 -
 31
31 -
 32
32 -
 33
33 -
 34
34 -
 35
35 -
 36
36 -
 37
37 -
 38
38 -
 39
39 -
 40
40 -
 41
41 -
 42
42 -
 43
43 -
 44
44 -
 45
45 -
 46
46 -
47
-
48
-
49
-
50
-
51
-
52
-
53
-
54
-
55
-
56
-
57
-
58
-
59
-
60
-
61
-
62
-
63
-
64
-
65
-
66
-
67
-
68
-
69
-
70
-
71
-
72
-
73
-
74
-
75
-
76
-
77
-
78
-
79
-
80
-
81
-
82
-
83
-
84
-
85
-
86
-
87
-
88
-
89
-
90
-
91
-
92
-
93
-
94
-
95
-
96
-
97
-
98
-
99
-
100
-
101
-
102
-
103
-
104
-
105
-
106
-
107
-
108
 |
 |
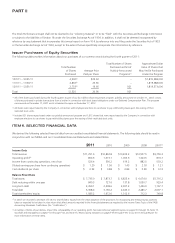
PART II
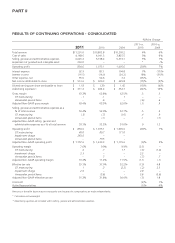
Selling, General and Administrative Expenses
Selling, general and administrative expenses for 2011 increased $277.0 as compared to 2010. This increase is primarily due to our continued
investing in RVP, as well as higher distribution costs and bad debt expense. We invested approximately $121.0 incrementally in our RVP
during 2011, by continued implementation of our Sales Leadership program and higher incentives. Selling, general and administrative
expenses during 2011, benefited from lower expenses associated with employee incentive compensation plans.
On an Adjusted Non-GAAP basis, excluding the impact of CTI restructuring and the Venezuelan special items, as a percentage of revenue,
selling, general and administrative expenses during 2011, increased by 90 basis points, as higher RVP, distribution costs and bad debt
expense were partially offset by lower advertising. Dual distribution costs attributable to the transition to the new facilities in Brazil and
Colombia negatively impacted selling, general and administrative expenses during 2011 as compared to 2010.
Selling, general and administrative expenses for 2010 increased $374.3 as compared to 2009. The increase was primarily due to: higher
advertising and RVP costs; significant professional and related fees associated with the FCPA investigation and compliance reviews described
in Note 16, Contingencies, to our 2011 Annual Report of approximately $95 (up approximately $59 from 2009); and higher volume related
costs, such as distribution costs, partially offset by lower CTI from our restructuring initiatives. On an Adjusted Non-GAAP basis, excluding
the impact of CTI restructuring and the Venezuelan special items, as a percentage of revenue, selling, general and administrative expenses
during 2010, increased by 1.2 points as compared to 2009, due to higher advertising and RVP costs and the significant professional and
related fees associated with the FCPA matters.
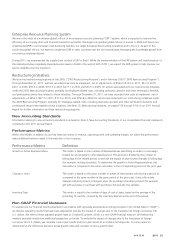
Impairment of Goodwill and Intangible Asset
During 2011 we recorded a non-cash impairment charge of $263.0 for goodwill and an indefinite-lived intangible asset associated with
Silpada. Refer to Note 17, Goodwill and Intangible Assets, to our 2011 Annual Report for more details.
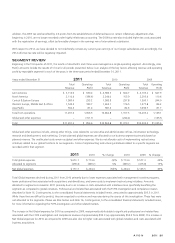
See the “Segment Review” section of MD&A for additional information related to changes in operating margin by segment.
Other Expenses
Interest expense during 2011 increased by 7% as compared to 2010, primarily due to higher outstanding debt balances. Interest expense
decreased by 17% in 2010 as compared to 2009 due to lower interest rates. At December 31, 2011 and 2010, we held interest-rate swap
agreements that effectively converted approximately 74% of our outstanding long-term, fixed-rate borrowings to a variable interest rate
based on LIBOR.
Interest income increased in 2011 as compared to 2010 due to higher average cash balances and higher interest rates. Interest income
decreased in 2010 as compared to 2009, primarily due to lower interest rates.
Other expense, net for 2011, as compared to 2010 decreased primarily due to a $46.1 negative impact in 2010 from the devaluation of the
Venezuelan currency on monetary assets and liabilities in conjunction with highly inflationary accounting which occurred in 2010, partially
offset by higher foreign exchange losses in 2011. Other expense, net for 2010 was higher than during 2009 as a result of the $46.1
Venezuelan currency devaluation. Refer to the Latin America segment review for a further discussion of the Venezuelan currency.
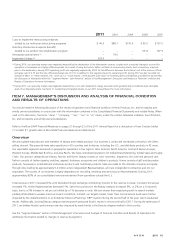
Effective Tax Rate
The effective tax rate for 2011 was 29.1%, compared to 37.0% for 2010 and 32.2% for 2009.
The effective tax rate for 2011 included tax benefits from audit settlements and statute expirations, which favorably impacted the tax rate by
3.1 points. In addition, the 2011 tax rate was favorably impacted by 2.0 points from the tax benefit on the impairment charge associated
with our Silpada business.
The effective tax rate for 2010 was unfavorably impacted by 5.6 points due to the devaluation of the Venezuelan currency in conjunction
with highly inflationary accounting discussed further within the Latin America Segment review, partially offset by 2.1 points associated with
benefits from audit settlements and statute expirations.
The effective tax rate for 2009 was unfavorably impacted by 3.4 points from the establishment of a valuation allowance against certain
deferred tax assets primarily as a result of restructuring activities, partially offset by 2.1 points from a reduction in a foreign tax liability. In