United Airlines 2013 Annual Report Download - page 89
Download and view the complete annual report
Please find page 89 of the 2013 United Airlines annual report below. You can navigate through the pages in the report by either clicking on the pages listed below, or by using the keyword search tool below to find specific information within the annual report.-
 1
1 -
2
-
3
-
4
-
5
-
6
-
7
-
8
-
9
-
10
-
11
-
12
-
13
-
14
-
15
-
16
-
17
-
18
-
19
-
20
-
21
-
22
-
23
-
24
-
25
-
26
-
27
-
28
-
29
-
30
-
31
-
32
-
33
-
34
-
35
-
36
-
37
-
38
-
39
-
40
-
41
-
42
-
43
-
44
-
45
-
46
-
47
-
48
-
49
-
50
-
51
-
52
-
53
-
54
-
55
-
56
-
57
-
58
-
59
-
60
-
61
-
62
-
63
-
64
-
65
-
66
-
67
-
68
-
69
-
70
-
71
-
72
-
73
-
74
-
75
-
76
-
77
-
78
-
 79
79 -
 80
80 -
 81
81 -
 82
82 -
 83
83 -
 84
84 -
 85
85 -
 86
86 -
 87
87 -
 88
88 -
 89
89 -
 90
90 -
 91
91 -
 92
92 -
 93
93 -
 94
94 -
 95
95 -
 96
96 -
 97
97 -
 98
98 -
 99
99 -
100
-
101
-
102
-
103
-
104
-
105
-
106
-
107
-
108
-
109
-
110
-
111
-
112
-
113
-
114
-
115
-
116
-
117
-
118
-
119
-
120
-
121
-
122
-
123
-
124
-
125
-
126
-
127
-
128
-
129
-
130
-
131
-
132
-
133
-
134
-
135
-
136
-
137
-
138
-
139
-
140
-
141
-
142
-
143
-
144
-
145
-
146
-
147
-
148
-
149
-
150
-
151
-
152
-
153
-
154
-
155
-
156
-
157
-
158
-
159
-
160
-
161
-
162
-
163
-
164
-
165
-
166
-
167
-
168
-
169
-
170
-
171
-
172
-
173
-
174
-
175
-
176
-
177
-
178
-
179
-
180
-
181
-
182
-
183
-
184
-
185
-
186
-
187
-
188
-
189
-
190
-
191
-
192
-
193
-
194
-
195
-
196
-
197
-
198
-
199
-
200
-
201
-
202
-
203
-
204
-
205
-
206
-
207
-
208
-
209
-
210
-
211
-
212
-
213
-
214
-
215
-
216
-
217
-
218
-
219
-
220
-
221
-
222
-
223
-
224
-
225
-
226
-
227
-
228
-
229
-
230
-
231
-
232
-
233
-
234
-
235
-
236
-
237
-
238
-
239
-
240
-
241
-
242
-
243
-
244
-
245
-
246
-
247
-
248
-
249
-
250
-
251
-
252
-
253
 |
 |

Table of Contents
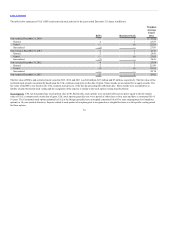
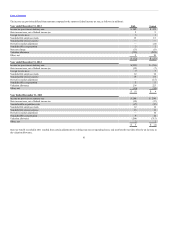
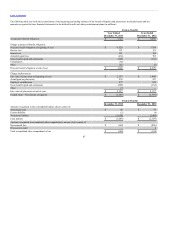
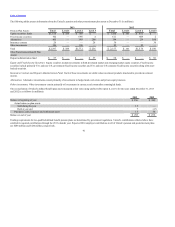
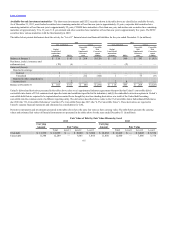
Net periodic benefit cost for the years ended December 31 included the following components (in millions):
Service cost $ 121 $ 52 $ 99 $ 50 $ 88 $ 47
Interest cost 191 110 184 124 178 127
Expected return on plan assets (163) (2) (138) (2) (140) (2)
Curtailment loss 2 2 — — — —
Amortization of prior service credits — (3) (1) — (2) —
Settlement (gain) loss (10) — 1 — 1 —
Amortization of unrecognized
actuarial (gain) loss 48 3 21 (3) (20) (2)
Net periodic benefit cost $ 189 $ 162 $ 166 $ 169 $ 105 $ 170
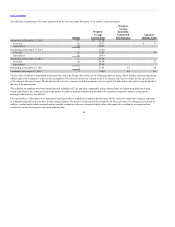
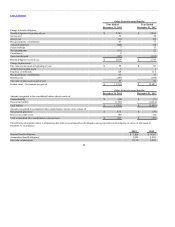
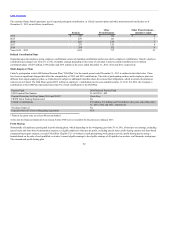
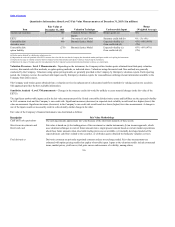
The estimated amounts that will be amortized in 2014 for actuarial (gains) losses are as follows (in millions):
Actuarial (gain) loss to be reclassified from accumulated other comprehensive income into net periodic
benefit cost $ 9 $ (46)
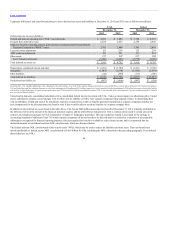
The assumptions used for the benefit plans were as follows:
Discount rate 5.09% 4.19%
Rate of compensation increase 3.49% 2.49%
Discount rate 4.48% 5.02%
Expected return on plan assets 7.56% 7.54%
Rate of compensation increase 2.48% 2.48%
Discount rate 4.94% 4.12%
Discount rate 4.12% 4.92%
Expected return on plan assets 4.00% 4.00%
Health care cost trend rate assumed for next year 7.25% 6.75%
Rate to which the cost trend rate is assumed to decline (ultimate trend rate in 2020) 5.00% 5.00%
89