United Airlines 2013 Annual Report Download - page 27
Download and view the complete annual report
Please find page 27 of the 2013 United Airlines annual report below. You can navigate through the pages in the report by either clicking on the pages listed below, or by using the keyword search tool below to find specific information within the annual report.-
 1
1 -
2
-
3
-
4
-
5
-
6
-
7
-
8
-
9
-
10
-
11
-
12
-
13
-
14
-
15
-
16
-
 17
17 -
 18
18 -
 19
19 -
 20
20 -
 21
21 -
 22
22 -
 23
23 -
 24
24 -
 25
25 -
 26
26 -
 27
27 -
 28
28 -
 29
29 -
 30
30 -
 31
31 -
 32
32 -
 33
33 -
 34
34 -
 35
35 -
 36
36 -
 37
37 -
38
-
39
-
40
-
41
-
42
-
43
-
44
-
45
-
46
-
47
-
48
-
49
-
50
-
51
-
52
-
53
-
54
-
55
-
56
-
57
-
58
-
59
-
60
-
61
-
62
-
63
-
64
-
65
-
66
-
67
-
68
-
69
-
70
-
71
-
72
-
73
-
74
-
75
-
76
-
77
-
78
-
79
-
80
-
81
-
82
-
83
-
84
-
85
-
86
-
87
-
88
-
89
-
90
-
91
-
92
-
93
-
94
-
95
-
96
-
97
-
98
-
99
-
100
-
101
-
102
-
103
-
104
-
105
-
106
-
107
-
108
-
109
-
110
-
111
-
112
-
113
-
114
-
115
-
116
-
117
-
118
-
119
-
120
-
121
-
122
-
123
-
124
-
125
-
126
-
127
-
128
-
129
-
130
-
131
-
132
-
133
-
134
-
135
-
136
-
137
-
138
-
139
-
140
-
141
-
142
-
143
-
144
-
145
-
146
-
147
-
148
-
149
-
150
-
151
-
152
-
153
-
154
-
155
-
156
-
157
-
158
-
159
-
160
-
161
-
162
-
163
-
164
-
165
-
166
-
167
-
168
-
169
-
170
-
171
-
172
-
173
-
174
-
175
-
176
-
177
-
178
-
179
-
180
-
181
-
182
-
183
-
184
-
185
-
186
-
187
-
188
-
189
-
190
-
191
-
192
-
193
-
194
-
195
-
196
-
197
-
198
-
199
-
200
-
201
-
202
-
203
-
204
-
205
-
206
-
207
-
208
-
209
-
210
-
211
-
212
-
213
-
214
-
215
-
216
-
217
-
218
-
219
-
220
-
221
-
222
-
223
-
224
-
225
-
226
-
227
-
228
-
229
-
230
-
231
-
232
-
233
-
234
-
235
-
236
-
237
-
238
-
239
-
240
-
241
-
242
-
243
-
244
-
245
-
246
-
247
-
248
-
249
-
250
-
251
-
252
-
253
 |
 |

Table of Contents
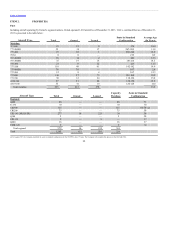
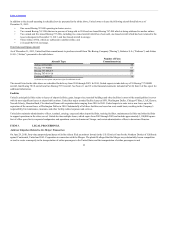
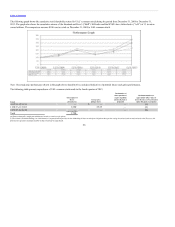
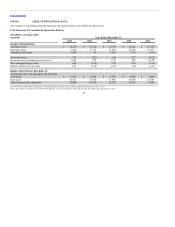
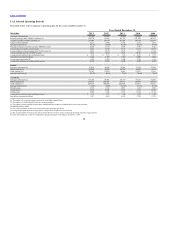
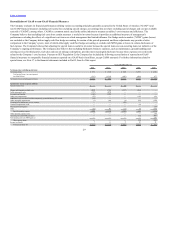
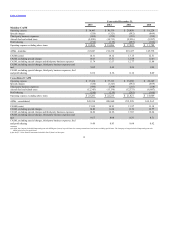
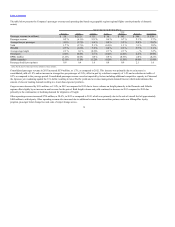
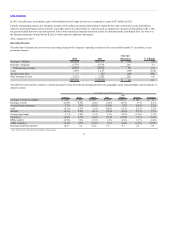
The Company’s consolidated financial statements and statistical data are provided in the tables below.
Operating revenue $ 38,279 $ 37,152 $ 37,110 $ 23,325 $ 16,335
Operating expense 37,030 37,113 35,288 22,349 16,496
Operating income (loss) 1,249 39 1,822 976 (161)
Net income (loss) 571 (723) 840 253 (651)
Net income (loss) excluding special items (b) 1,084 589 1,323 942 (1,128)
Basic earnings (loss) per share 1.64 (2.18) 2.54 1.22 (4.32)
Diluted earnings (loss) per share 1.53 (2.18) 2.26 1.08 (4.32)
Unrestricted cash, cash equivalents and short-term
investments $ 5,121 $ 6,543 $ 7,762 $ 8,680 $ 3,042
Total assets 36,812 37,628 37,988 39,598 18,684
Debt and capital lease obligations 12,409 13,166 12,735 15,133 8,543
(a) UAL financial results include the operations of Continental and its subsidiaries for the period subsequent to the Merger on October 1, 2010.
(b) See “Reconciliation of GAAP to non-GAAP Financial Measures” in this Item 6 for further details related to items that significantly impacted UAL’s results.
27