United Airlines 2013 Annual Report Download - page 33
Download and view the complete annual report
Please find page 33 of the 2013 United Airlines annual report below. You can navigate through the pages in the report by either clicking on the pages listed below, or by using the keyword search tool below to find specific information within the annual report.-
 1
1 -
2
-
3
-
4
-
5
-
6
-
7
-
8
-
9
-
10
-
11
-
12
-
13
-
14
-
15
-
16
-
17
-
18
-
19
-
20
-
21
-
22
-
 23
23 -
 24
24 -
 25
25 -
 26
26 -
 27
27 -
 28
28 -
 29
29 -
 30
30 -
 31
31 -
 32
32 -
 33
33 -
 34
34 -
 35
35 -
 36
36 -
 37
37 -
 38
38 -
 39
39 -
 40
40 -
 41
41 -
 42
42 -
 43
43 -
44
-
45
-
46
-
47
-
48
-
49
-
50
-
51
-
52
-
53
-
54
-
55
-
56
-
57
-
58
-
59
-
60
-
61
-
62
-
63
-
64
-
65
-
66
-
67
-
68
-
69
-
70
-
71
-
72
-
73
-
74
-
75
-
76
-
77
-
78
-
79
-
80
-
81
-
82
-
83
-
84
-
85
-
86
-
87
-
88
-
89
-
90
-
91
-
92
-
93
-
94
-
95
-
96
-
97
-
98
-
99
-
100
-
101
-
102
-
103
-
104
-
105
-
106
-
107
-
108
-
109
-
110
-
111
-
112
-
113
-
114
-
115
-
116
-
117
-
118
-
119
-
120
-
121
-
122
-
123
-
124
-
125
-
126
-
127
-
128
-
129
-
130
-
131
-
132
-
133
-
134
-
135
-
136
-
137
-
138
-
139
-
140
-
141
-
142
-
143
-
144
-
145
-
146
-
147
-
148
-
149
-
150
-
151
-
152
-
153
-
154
-
155
-
156
-
157
-
158
-
159
-
160
-
161
-
162
-
163
-
164
-
165
-
166
-
167
-
168
-
169
-
170
-
171
-
172
-
173
-
174
-
175
-
176
-
177
-
178
-
179
-
180
-
181
-
182
-
183
-
184
-
185
-
186
-
187
-
188
-
189
-
190
-
191
-
192
-
193
-
194
-
195
-
196
-
197
-
198
-
199
-
200
-
201
-
202
-
203
-
204
-
205
-
206
-
207
-
208
-
209
-
210
-
211
-
212
-
213
-
214
-
215
-
216
-
217
-
218
-
219
-
220
-
221
-
222
-
223
-
224
-
225
-
226
-
227
-
228
-
229
-
230
-
231
-
232
-
233
-
234
-
235
-
236
-
237
-
238
-
239
-
240
-
241
-
242
-
243
-
244
-
245
-
246
-
247
-
248
-
249
-
250
-
251
-
252
-
253
 |
 |

Table of Contents
Labor. As of December 31, 2013, United had approximately 80% of employees represented by unions. During 2013, the Company accepted an integrated
seniority list for its pilots from the Air Line Pilots Association, International. The Company also announced that the fleet service, passenger service and
storekeeper work groups at its United, CMI and MileagePlus subsidiaries ratified new joint labor agreements. We are in the process of negotiating amended
collective bargaining agreements with our remaining employee groups without joint collective bargaining agreements, including our technicians, flight
attendants and dispatchers. The Company cannot predict the outcome of negotiations with its unionized employee groups, although significant increases in the
pay and benefits resulting from new collective bargaining agreements would have a material financial impact on the Company.
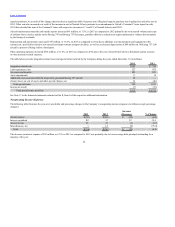
CASM. In 2014, the Company expects CASM, excluding fuel, third-party business expense, profit sharing and special charges to increase 1% to 2% year-
over-year.
The Company has begun a project to reduce its annual costs by $2 billion and generate an incremental $700 million in additional ancillary revenue by the end
of 2017. The savings are comprised of $1 billion in annual fuel savings and $1 billion of non-fuel savings.
In this section, we compare results of operations for the year ended December 31, 2013 with results of operations for the year ended December 31, 2012, and
results of operations for the year ended December 31, 2012 with results of operations for the year ended December 31, 2011. Non-GAAP financial measures
are presented because they provide management and investors with the ability to measure and monitor the Company’s performance on a consistent basis.
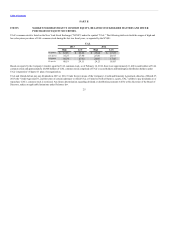
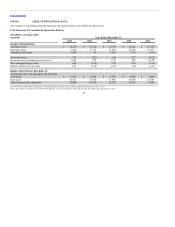
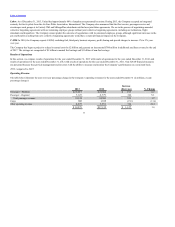
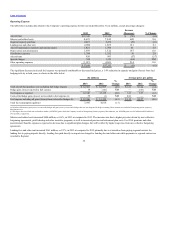
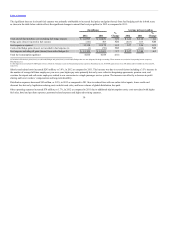
Operating Revenue
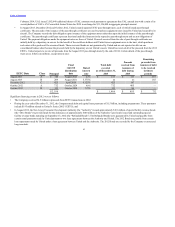
The table below illustrates the year-over-year percentage change in the Company’s operating revenues for the years ended December 31 (in millions, except
percentage changes):
Passenger—Mainline $25,997 $25,804 $ 193 0.7
Passenger—Regional 7,125 6,779 346 5.1
Total passenger revenue 33,122 32,583 539 1.7
Cargo 882 1,018 (136) (13.4)
Other operating revenue 4,275 3,551 724 20.4
$ 38,279 $37,152 $ 1,127 3.0
33