United Airlines 2013 Annual Report Download - page 83
Download and view the complete annual report
Please find page 83 of the 2013 United Airlines annual report below. You can navigate through the pages in the report by either clicking on the pages listed below, or by using the keyword search tool below to find specific information within the annual report.-
 1
1 -
2
-
3
-
4
-
5
-
6
-
7
-
8
-
9
-
10
-
11
-
12
-
13
-
14
-
15
-
16
-
17
-
18
-
19
-
20
-
21
-
22
-
23
-
24
-
25
-
26
-
27
-
28
-
29
-
30
-
31
-
32
-
33
-
34
-
35
-
36
-
37
-
38
-
39
-
40
-
41
-
42
-
43
-
44
-
45
-
46
-
47
-
48
-
49
-
50
-
51
-
52
-
53
-
54
-
55
-
56
-
57
-
58
-
59
-
60
-
61
-
62
-
63
-
64
-
65
-
66
-
67
-
68
-
69
-
70
-
71
-
72
-
 73
73 -
 74
74 -
 75
75 -
 76
76 -
 77
77 -
 78
78 -
 79
79 -
 80
80 -
 81
81 -
 82
82 -
 83
83 -
 84
84 -
 85
85 -
 86
86 -
 87
87 -
 88
88 -
 89
89 -
 90
90 -
 91
91 -
 92
92 -
 93
93 -
94
-
95
-
96
-
97
-
98
-
99
-
100
-
101
-
102
-
103
-
104
-
105
-
106
-
107
-
108
-
109
-
110
-
111
-
112
-
113
-
114
-
115
-
116
-
117
-
118
-
119
-
120
-
121
-
122
-
123
-
124
-
125
-
126
-
127
-
128
-
129
-
130
-
131
-
132
-
133
-
134
-
135
-
136
-
137
-
138
-
139
-
140
-
141
-
142
-
143
-
144
-
145
-
146
-
147
-
148
-
149
-
150
-
151
-
152
-
153
-
154
-
155
-
156
-
157
-
158
-
159
-
160
-
161
-
162
-
163
-
164
-
165
-
166
-
167
-
168
-
169
-
170
-
171
-
172
-
173
-
174
-
175
-
176
-
177
-
178
-
179
-
180
-
181
-
182
-
183
-
184
-
185
-
186
-
187
-
188
-
189
-
190
-
191
-
192
-
193
-
194
-
195
-
196
-
197
-
198
-
199
-
200
-
201
-
202
-
203
-
204
-
205
-
206
-
207
-
208
-
209
-
210
-
211
-
212
-
213
-
214
-
215
-
216
-
217
-
218
-
219
-
220
-
221
-
222
-
223
-
224
-
225
-
226
-
227
-
228
-
229
-
230
-
231
-
232
-
233
-
234
-
235
-
236
-
237
-
238
-
239
-
240
-
241
-
242
-
243
-
244
-
245
-
246
-
247
-
248
-
249
-
250
-
251
-
252
-
253
 |
 |

Table of Contents
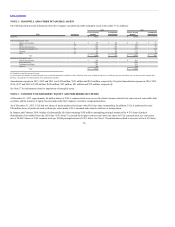
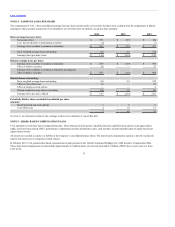
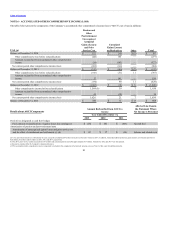
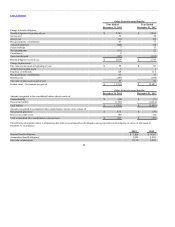
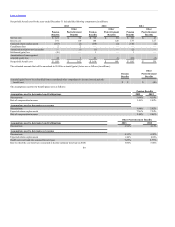
The income tax provision differed from amounts computed at the statutory federal income tax rate, as follows (in millions):
Income tax provision at statutory rate $ 189 $ 223
State income taxes, net of federal income tax 5 5
Foreign income taxes 3 3
Nondeductible employee meals 15 15
Nondeductible interest expense — —
Derivative market adjustment — (24)
Nondeductible compensation 3 3
State rate change (33) (33)
Valuation allowance (219) (229)
Other, net 5 20
$ (32) $ (17)
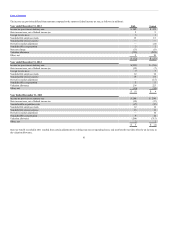
Income tax provision at statutory rate $(253) $(230)
State income taxes, net of federal income tax (15) (7)
Foreign income taxes 7 7
Nondeductible employee meals 12 12
Nondeductible interest expense 19 19
Derivative market adjustment — (15)
Nondeductible compensation 5 5
Valuation allowance 234 223
Other, net (10) (10)
$ (1) $ 4
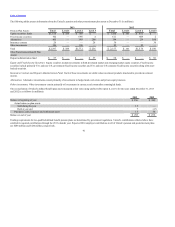
Income tax provision at statutory rate $ 298 $299
State income taxes, net of federal income tax (19) (17)
Nondeductible acquisition costs (17) (17)
Nondeductible employee meals 12 12
Nondeductible interest expense 13 13
Derivative market adjustment — 10
Nondeductible compensation 9 10
Valuation allowance (294) (315)
Other, net 3 3
$ 5 $ (2)
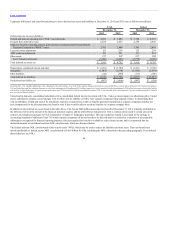
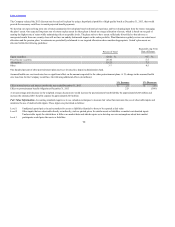
State tax benefit recorded in 2011 resulted from certain adjustments to existing state tax net operating losses, and such benefit was fully offset by an increase in
the valuation allowance.
83