United Airlines 2013 Annual Report Download - page 51
Download and view the complete annual report
Please find page 51 of the 2013 United Airlines annual report below. You can navigate through the pages in the report by either clicking on the pages listed below, or by using the keyword search tool below to find specific information within the annual report.-
 1
1 -
2
-
3
-
4
-
5
-
6
-
7
-
8
-
9
-
10
-
11
-
12
-
13
-
14
-
15
-
16
-
17
-
18
-
19
-
20
-
21
-
22
-
23
-
24
-
25
-
26
-
27
-
28
-
29
-
30
-
31
-
32
-
33
-
34
-
35
-
36
-
37
-
38
-
39
-
40
-
 41
41 -
 42
42 -
 43
43 -
 44
44 -
 45
45 -
 46
46 -
 47
47 -
 48
48 -
 49
49 -
 50
50 -
 51
51 -
 52
52 -
 53
53 -
 54
54 -
 55
55 -
 56
56 -
 57
57 -
 58
58 -
 59
59 -
 60
60 -
 61
61 -
62
-
63
-
64
-
65
-
66
-
67
-
68
-
69
-
70
-
71
-
72
-
73
-
74
-
75
-
76
-
77
-
78
-
79
-
80
-
81
-
82
-
83
-
84
-
85
-
86
-
87
-
88
-
89
-
90
-
91
-
92
-
93
-
94
-
95
-
96
-
97
-
98
-
99
-
100
-
101
-
102
-
103
-
104
-
105
-
106
-
107
-
108
-
109
-
110
-
111
-
112
-
113
-
114
-
115
-
116
-
117
-
118
-
119
-
120
-
121
-
122
-
123
-
124
-
125
-
126
-
127
-
128
-
129
-
130
-
131
-
132
-
133
-
134
-
135
-
136
-
137
-
138
-
139
-
140
-
141
-
142
-
143
-
144
-
145
-
146
-
147
-
148
-
149
-
150
-
151
-
152
-
153
-
154
-
155
-
156
-
157
-
158
-
159
-
160
-
161
-
162
-
163
-
164
-
165
-
166
-
167
-
168
-
169
-
170
-
171
-
172
-
173
-
174
-
175
-
176
-
177
-
178
-
179
-
180
-
181
-
182
-
183
-
184
-
185
-
186
-
187
-
188
-
189
-
190
-
191
-
192
-
193
-
194
-
195
-
196
-
197
-
198
-
199
-
200
-
201
-
202
-
203
-
204
-
205
-
206
-
207
-
208
-
209
-
210
-
211
-
212
-
213
-
214
-
215
-
216
-
217
-
218
-
219
-
220
-
221
-
222
-
223
-
224
-
225
-
226
-
227
-
228
-
229
-
230
-
231
-
232
-
233
-
234
-
235
-
236
-
237
-
238
-
239
-
240
-
241
-
242
-
243
-
244
-
245
-
246
-
247
-
248
-
249
-
250
-
251
-
252
-
253
 |
 |

Table of Contents
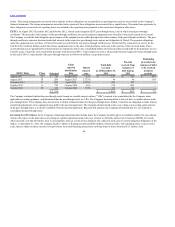
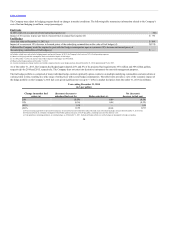
obligations, which has resulted in a significant net obligation, as discussed below. The Company’s benefit obligation was $1.8 billion and $2.7 billion for the
other postretirement benefit plans at December 31, 2013 and 2012, respectively.
The calculation of other postretirement benefit expense and obligations requires the use of a number of assumptions, including the assumed discount rate for
measuring future payment obligations and the health care cost trend rate. The Company determines the appropriate discount rate for each of the plans based on
current rates on high quality corporate bonds that would generate the cash flow necessary to pay plan benefits when due. The Company’s weighted average
discount rate to determine its benefit obligations as of December 31, 2013 was 4.94%, as compared to 4.12% for December 31, 2012. The health care cost
trend rate assumed for 2013 was 6.75%, declining to 5% in 2020, as compared to assumed trend rate for 2014 of 7.25%, declining to 5.0% in 2020. A 1%
increase in assumed health care trend rates would increase the Company’s total service and interest cost for the year ended December 31, 2013 by $21 million;
whereas, a 1% decrease in assumed health care trend rates would decrease the Company’s total service and interest cost for the year ended December 31, 2013
by $17 million. A one percentage point decrease in the weighted average discount rate would increase the Company’s postretirement benefit liability by
approximately $203 million and increase the estimated 2013 benefits expense by approximately $10 million.
Actuarial gains or losses are triggered by changes in assumptions or experience that differ from the original assumptions and prior service credits result from a
retroactive reduction in benefits due under the plans. Under the applicable accounting standards for postretirement welfare benefit plans, actuarial gains and
losses and prior service credits are not required to be recognized currently, but instead may be deferred as part of accumulated other comprehensive income and
amortized into expense over the average remaining service life of the covered active employees or the average life expectancy of inactive participants and will
reduce 2013 pension and retiree medical expense. At December 31, 2013 and 2012, the Company had unrecognized actuarial gains/(losses) for postretirement
welfare benefit plans of $555 million and $(79) million, respectively, recorded in accumulated other comprehensive income.
During 2013, the Company experienced significant changes in its benefit obligations related to its postretirement medical programs. The significant changes
resulted from the reduction or elimination of benefits for certain work groups including elimination of the postretirement medical benefits for management and
administrative employees and International Association of Machinists employees with less than 20 years of service. These changes are reflected in the
December 31, 2013 obligation. In addition, certain key actuarial changes resulted in an additional net reduction of the postretirement medical benefit
obligations, principally market increases in discount rates, changes in participation and retirement rates for retiree medical plans (driven primarily by the
actual experience in pilot retirement rates resulting from a change of the mandatory pilot retirement age to 65), partially offset by an increase in health care
trend rates for postretirement medical plans. These changes in benefits that either qualified as curtailments (which reduced prior actuarial losses) or negative
plan amendments are further described in Note 8 to the financial statements included in Part II, Item 8 of this report for additional information related to
pension and postretirement plans. Actuarial assumption changes are reflected as a component of the net actuarial gains/(losses) during 2013.
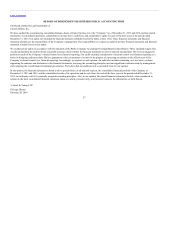
Income Taxes
The ultimate realization of deferred tax assets is dependent upon the generation of future taxable income (including the reversals of deferred tax liabilities)
during the periods in which those deferred tax assets will become deductible. The Company’s management assesses available positive and negative evidence
regarding the realizability of its deferred tax assets and records a valuation allowance when it is more likely than not that deferred tax assets will not be realized.
To form a conclusion, management considers positive evidence in the form of reversing temporary differences, projections of future taxable income and tax
planning strategies, and negative evidence such as recent history of losses. Although the Company was not in a three-year cumulative loss position at the end
of 2013, management determined that the loss in 2012, the overall modest level of cumulative pretax income in the three years ended December 31, 2013 of
0.6% of total revenues in that period
51