United Airlines 2013 Annual Report Download - page 69
Download and view the complete annual report
Please find page 69 of the 2013 United Airlines annual report below. You can navigate through the pages in the report by either clicking on the pages listed below, or by using the keyword search tool below to find specific information within the annual report.-
 1
1 -
2
-
3
-
4
-
5
-
6
-
7
-
8
-
9
-
10
-
11
-
12
-
13
-
14
-
15
-
16
-
17
-
18
-
19
-
20
-
21
-
22
-
23
-
24
-
25
-
26
-
27
-
28
-
29
-
30
-
31
-
32
-
33
-
34
-
35
-
36
-
37
-
38
-
39
-
40
-
41
-
42
-
43
-
44
-
45
-
46
-
47
-
48
-
49
-
50
-
51
-
52
-
53
-
54
-
55
-
56
-
57
-
58
-
 59
59 -
 60
60 -
 61
61 -
 62
62 -
 63
63 -
 64
64 -
 65
65 -
 66
66 -
 67
67 -
 68
68 -
 69
69 -
 70
70 -
 71
71 -
 72
72 -
 73
73 -
 74
74 -
 75
75 -
 76
76 -
 77
77 -
 78
78 -
 79
79 -
80
-
81
-
82
-
83
-
84
-
85
-
86
-
87
-
88
-
89
-
90
-
91
-
92
-
93
-
94
-
95
-
96
-
97
-
98
-
99
-
100
-
101
-
102
-
103
-
104
-
105
-
106
-
107
-
108
-
109
-
110
-
111
-
112
-
113
-
114
-
115
-
116
-
117
-
118
-
119
-
120
-
121
-
122
-
123
-
124
-
125
-
126
-
127
-
128
-
129
-
130
-
131
-
132
-
133
-
134
-
135
-
136
-
137
-
138
-
139
-
140
-
141
-
142
-
143
-
144
-
145
-
146
-
147
-
148
-
149
-
150
-
151
-
152
-
153
-
154
-
155
-
156
-
157
-
158
-
159
-
160
-
161
-
162
-
163
-
164
-
165
-
166
-
167
-
168
-
169
-
170
-
171
-
172
-
173
-
174
-
175
-
176
-
177
-
178
-
179
-
180
-
181
-
182
-
183
-
184
-
185
-
186
-
187
-
188
-
189
-
190
-
191
-
192
-
193
-
194
-
195
-
196
-
197
-
198
-
199
-
200
-
201
-
202
-
203
-
204
-
205
-
206
-
207
-
208
-
209
-
210
-
211
-
212
-
213
-
214
-
215
-
216
-
217
-
218
-
219
-
220
-
221
-
222
-
223
-
224
-
225
-
226
-
227
-
228
-
229
-
230
-
231
-
232
-
233
-
234
-
235
-
236
-
237
-
238
-
239
-
240
-
241
-
242
-
243
-
244
-
245
-
246
-
247
-
248
-
249
-
250
-
251
-
252
-
253
 |
 |

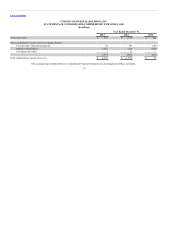
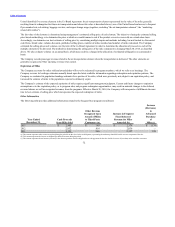
Table of Contents
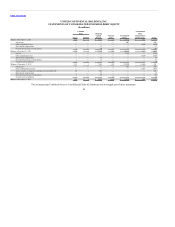
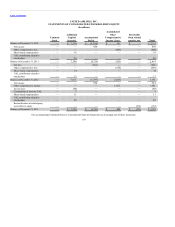
Balance at December 31, 2010 — $ 7,536 $ (5,586) $ 381 $ — $ 2,331
Net income — — 850 — — 850
Other comprehensive loss — — — (806) — (806)
Share-based compensation — 18 — — — 18
UAL contribution related to
stock plans — 26 — — — 26
Balance at December 31, 2011 — 7,580 (4,736) (425) — 2,419
Net loss — — (661) — — (661)
Other comprehensive loss — — — (628) — (628)
Share-based compensation — 14 — — — 14
UAL contribution related to
stock plans — 17 — — — 17
Balance at December 31, 2012 — 7,611 (5,397) (1,053) — 1,161
Net income — — 654 — — 654
Other comprehensive income — — — 1,661 — 1,661
Income taxes — (68) — — — (68)
Contribution of asset by UAL — 7 — — — 7
Share-based compensation — 11 — — — 11
UAL contribution related to
stock plans — 29 — — — 29
Reclassification of related party
receivables to equity — — — — (232) (232)
Balance at December 31, 2013 — $ 7,590 $ (4,743) $ 608 $ (232) $ 3,223
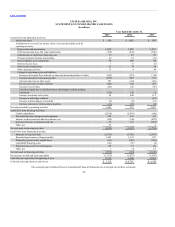
The accompanying Combined Notes to Consolidated Financial Statements are an integral part of these statements.
69