United Airlines 2013 Annual Report Download - page 243
Download and view the complete annual report
Please find page 243 of the 2013 United Airlines annual report below. You can navigate through the pages in the report by either clicking on the pages listed below, or by using the keyword search tool below to find specific information within the annual report.-
 1
1 -
2
-
3
-
4
-
5
-
6
-
7
-
8
-
9
-
10
-
11
-
12
-
13
-
14
-
15
-
16
-
17
-
18
-
19
-
20
-
21
-
22
-
23
-
24
-
25
-
26
-
27
-
28
-
29
-
30
-
31
-
32
-
33
-
34
-
35
-
36
-
37
-
38
-
39
-
40
-
41
-
42
-
43
-
44
-
45
-
46
-
47
-
48
-
49
-
50
-
51
-
52
-
53
-
54
-
55
-
56
-
57
-
58
-
59
-
60
-
61
-
62
-
63
-
64
-
65
-
66
-
67
-
68
-
69
-
70
-
71
-
72
-
73
-
74
-
75
-
76
-
77
-
78
-
79
-
80
-
81
-
82
-
83
-
84
-
85
-
86
-
87
-
88
-
89
-
90
-
91
-
92
-
93
-
94
-
95
-
96
-
97
-
98
-
99
-
100
-
101
-
102
-
103
-
104
-
105
-
106
-
107
-
108
-
109
-
110
-
111
-
112
-
113
-
114
-
115
-
116
-
117
-
118
-
119
-
120
-
121
-
122
-
123
-
124
-
125
-
126
-
127
-
128
-
129
-
130
-
131
-
132
-
133
-
134
-
135
-
136
-
137
-
138
-
139
-
140
-
141
-
142
-
143
-
144
-
145
-
146
-
147
-
148
-
149
-
150
-
151
-
152
-
153
-
154
-
155
-
156
-
157
-
158
-
159
-
160
-
161
-
162
-
163
-
164
-
165
-
166
-
167
-
168
-
169
-
170
-
171
-
172
-
173
-
174
-
175
-
176
-
177
-
178
-
179
-
180
-
181
-
182
-
183
-
184
-
185
-
186
-
187
-
188
-
189
-
190
-
191
-
192
-
193
-
194
-
195
-
196
-
197
-
198
-
199
-
200
-
201
-
202
-
203
-
204
-
205
-
206
-
207
-
208
-
209
-
210
-
211
-
212
-
213
-
214
-
215
-
216
-
217
-
218
-
219
-
220
-
221
-
222
-
223
-
224
-
225
-
226
-
227
-
228
-
229
-
230
-
231
-
232
-
 233
233 -
 234
234 -
 235
235 -
 236
236 -
 237
237 -
 238
238 -
 239
239 -
 240
240 -
 241
241 -
 242
242 -
 243
243 -
 244
244 -
 245
245 -
 246
246 -
 247
247 -
 248
248 -
 249
249 -
 250
250 -
 251
251 -
 252
252 -
 253
253
 |
 |

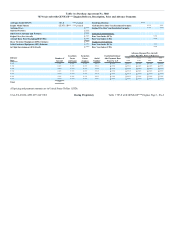
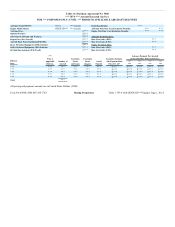
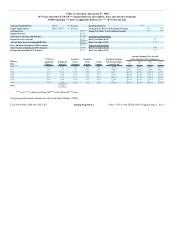
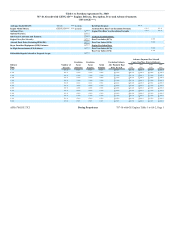
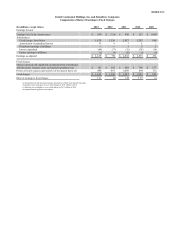
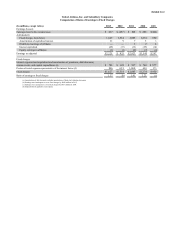
Exhibit 12.2
United Airlines, Inc. and Subsidiary Companies
Computation of Ratio of Earnings to Fixed Charges
(In millions, except ratios) 2013 2012 2011 2010 2009
Earnings (losses):
Earnings (loss) before income taxes
$ 637
$ (657)
$ 848
$ 286
$(644)
Add (deduct):
Fixed charges, from below
1,627
1,514
2,005
1,274
950
Amortization of capitalized interest
11
9
7
5
3
Distributed earnings of affiliates
—
—
1
2
2
Interest capitalized
(49)
(37)
(32)
(15)
(10)
Equity earnings in affiliates
(1)
(4)
(6)
(7)
(4)
Earnings as adjusted
$2,225
$ 825
$2,823
$1,545
$297
Fixed charges:
Interest expensed and capitalized and amortization of premiums, debt discounts,
issuance costs, and capital expenditures (a)
$ 781
$ 823
$ 937
$ 780
$577
Portion of rental expense representative of the interest factor (d)
846
691
1,068
494
373
Fixed charges
$1,627
$1,514
$2,005
$1,274
$950
Ratio of earnings to fixed charges
1.37
(b)
1.41
1.21
(c)
(a) Amortization of debt discounts includes amortization of fresh-start valuation discounts.
(b) Earnings were inadequate to cover fixed charges by $689 million in 2012.
(c) Earnings were inadequate to cover fixed charges by $653 million in 2009.
(d) Imputed interest applied to rent expense.