United Airlines 2013 Annual Report Download - page 87
Download and view the complete annual report
Please find page 87 of the 2013 United Airlines annual report below. You can navigate through the pages in the report by either clicking on the pages listed below, or by using the keyword search tool below to find specific information within the annual report.-
 1
1 -
2
-
3
-
4
-
5
-
6
-
7
-
8
-
9
-
10
-
11
-
12
-
13
-
14
-
15
-
16
-
17
-
18
-
19
-
20
-
21
-
22
-
23
-
24
-
25
-
26
-
27
-
28
-
29
-
30
-
31
-
32
-
33
-
34
-
35
-
36
-
37
-
38
-
39
-
40
-
41
-
42
-
43
-
44
-
45
-
46
-
47
-
48
-
49
-
50
-
51
-
52
-
53
-
54
-
55
-
56
-
57
-
58
-
59
-
60
-
61
-
62
-
63
-
64
-
65
-
66
-
67
-
68
-
69
-
70
-
71
-
72
-
73
-
74
-
75
-
76
-
 77
77 -
 78
78 -
 79
79 -
 80
80 -
 81
81 -
 82
82 -
 83
83 -
 84
84 -
 85
85 -
 86
86 -
 87
87 -
 88
88 -
 89
89 -
 90
90 -
 91
91 -
 92
92 -
 93
93 -
 94
94 -
 95
95 -
 96
96 -
 97
97 -
98
-
99
-
100
-
101
-
102
-
103
-
104
-
105
-
106
-
107
-
108
-
109
-
110
-
111
-
112
-
113
-
114
-
115
-
116
-
117
-
118
-
119
-
120
-
121
-
122
-
123
-
124
-
125
-
126
-
127
-
128
-
129
-
130
-
131
-
132
-
133
-
134
-
135
-
136
-
137
-
138
-
139
-
140
-
141
-
142
-
143
-
144
-
145
-
146
-
147
-
148
-
149
-
150
-
151
-
152
-
153
-
154
-
155
-
156
-
157
-
158
-
159
-
160
-
161
-
162
-
163
-
164
-
165
-
166
-
167
-
168
-
169
-
170
-
171
-
172
-
173
-
174
-
175
-
176
-
177
-
178
-
179
-
180
-
181
-
182
-
183
-
184
-
185
-
186
-
187
-
188
-
189
-
190
-
191
-
192
-
193
-
194
-
195
-
196
-
197
-
198
-
199
-
200
-
201
-
202
-
203
-
204
-
205
-
206
-
207
-
208
-
209
-
210
-
211
-
212
-
213
-
214
-
215
-
216
-
217
-
218
-
219
-
220
-
221
-
222
-
223
-
224
-
225
-
226
-
227
-
228
-
229
-
230
-
231
-
232
-
233
-
234
-
235
-
236
-
237
-
238
-
239
-
240
-
241
-
242
-
243
-
244
-
245
-
246
-
247
-
248
-
249
-
250
-
251
-
252
-
253
 |
 |
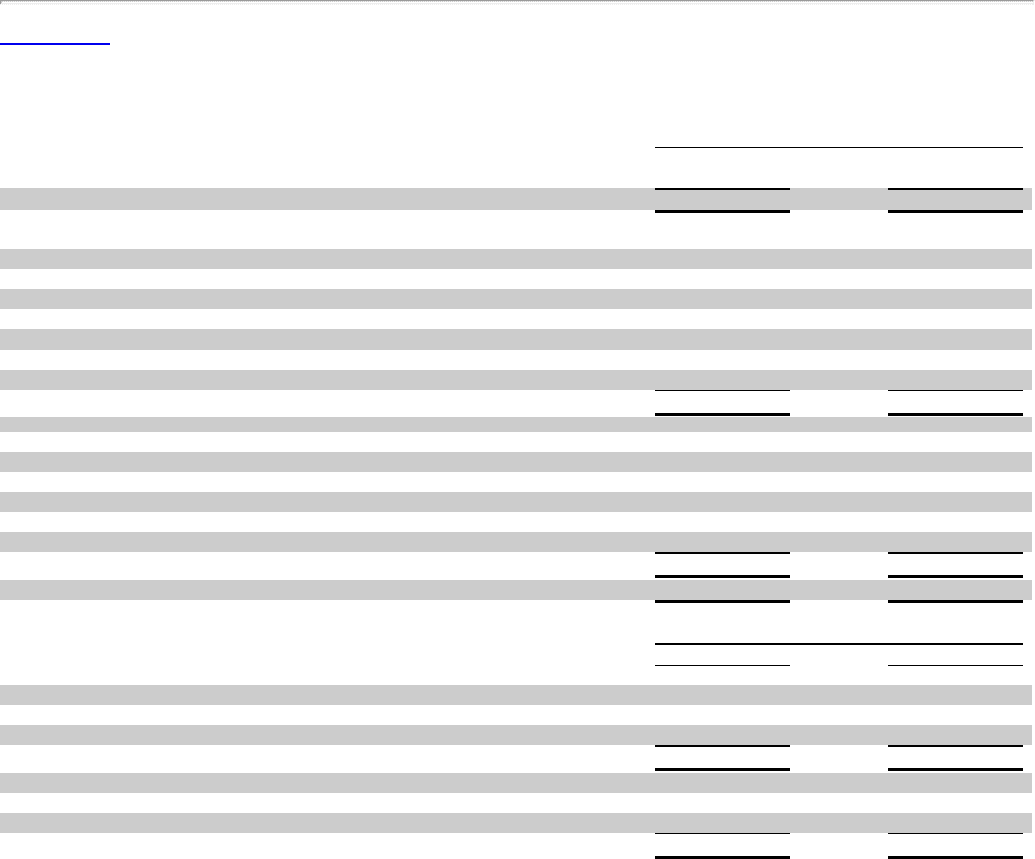
Table of Contents
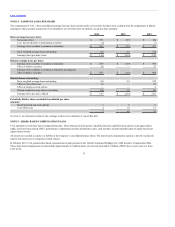
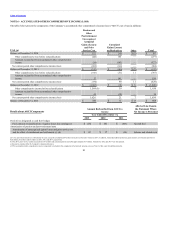
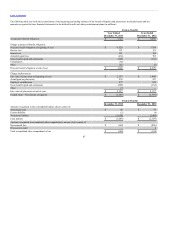
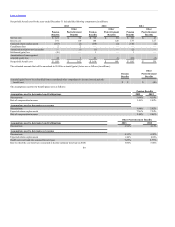
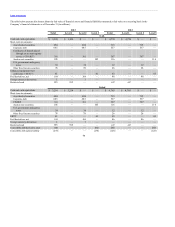
The following table sets forth the reconciliation of the beginning and ending balances of the benefit obligation and plan assets, the funded status and the
amounts recognized in these financial statements for the defined benefit and other postretirement plans (in millions):
Accumulated benefit obligation: $ 3,383 $ 3,978
Change in projected benefit obligation:
Projected benefit obligation at beginning of year $ 4,526 $ 3,708
Service cost 121 99
Interest cost 191 184
Actuarial (gain) loss (464) 702
Gross benefits paid and settlements (269) (162)
Curtailments (84) —
Other (21) (5)
Projected benefit obligation at end of year $ 4,000 $ 4,526
Change in plan assets:
Fair value of plan assets at beginning of year $ 2,157 $ 1,868
Actual gain on plan assets 239 223
Employer contributions 277 228
Gross benefits paid and settlements (269) (162)
Other (7) —
Fair value of plan assets at end of year $ 2,397 $ 2,157
Funded status—Net amount recognized $ (1,603) $ (2,369)
Amounts recognized in the consolidated balance sheets consist of:
Noncurrent asset $ 49 $ 35
Current liability (2) (4)
Noncurrent liability (1,650) (2,400)
Total liability $ (1,603) $ (2,369)
Amounts recognized in accumulated other comprehensive income (loss) consist of:
Net actuarial loss $ (162) $ (826)
Prior service credit — 2
Total accumulated other comprehensive loss $ (162) $ (824)
87