United Airlines 2013 Annual Report Download - page 79
Download and view the complete annual report
Please find page 79 of the 2013 United Airlines annual report below. You can navigate through the pages in the report by either clicking on the pages listed below, or by using the keyword search tool below to find specific information within the annual report.-
 1
1 -
2
-
3
-
4
-
5
-
6
-
7
-
8
-
9
-
10
-
11
-
12
-
13
-
14
-
15
-
16
-
17
-
18
-
19
-
20
-
21
-
22
-
23
-
24
-
25
-
26
-
27
-
28
-
29
-
30
-
31
-
32
-
33
-
34
-
35
-
36
-
37
-
38
-
39
-
40
-
41
-
42
-
43
-
44
-
45
-
46
-
47
-
48
-
49
-
50
-
51
-
52
-
53
-
54
-
55
-
56
-
57
-
58
-
59
-
60
-
61
-
62
-
63
-
64
-
65
-
66
-
67
-
68
-
 69
69 -
 70
70 -
 71
71 -
 72
72 -
 73
73 -
 74
74 -
 75
75 -
 76
76 -
 77
77 -
 78
78 -
 79
79 -
 80
80 -
 81
81 -
 82
82 -
 83
83 -
 84
84 -
 85
85 -
 86
86 -
 87
87 -
 88
88 -
 89
89 -
90
-
91
-
92
-
93
-
94
-
95
-
96
-
97
-
98
-
99
-
100
-
101
-
102
-
103
-
104
-
105
-
106
-
107
-
108
-
109
-
110
-
111
-
112
-
113
-
114
-
115
-
116
-
117
-
118
-
119
-
120
-
121
-
122
-
123
-
124
-
125
-
126
-
127
-
128
-
129
-
130
-
131
-
132
-
133
-
134
-
135
-
136
-
137
-
138
-
139
-
140
-
141
-
142
-
143
-
144
-
145
-
146
-
147
-
148
-
149
-
150
-
151
-
152
-
153
-
154
-
155
-
156
-
157
-
158
-
159
-
160
-
161
-
162
-
163
-
164
-
165
-
166
-
167
-
168
-
169
-
170
-
171
-
172
-
173
-
174
-
175
-
176
-
177
-
178
-
179
-
180
-
181
-
182
-
183
-
184
-
185
-
186
-
187
-
188
-
189
-
190
-
191
-
192
-
193
-
194
-
195
-
196
-
197
-
198
-
199
-
200
-
201
-
202
-
203
-
204
-
205
-
206
-
207
-
208
-
209
-
210
-
211
-
212
-
213
-
214
-
215
-
216
-
217
-
218
-
219
-
220
-
221
-
222
-
223
-
224
-
225
-
226
-
227
-
228
-
229
-
230
-
231
-
232
-
233
-
234
-
235
-
236
-
237
-
238
-
239
-
240
-
241
-
242
-
243
-
244
-
245
-
246
-
247
-
248
-
249
-
250
-
251
-
252
-
253
 |
 |

Table of Contents
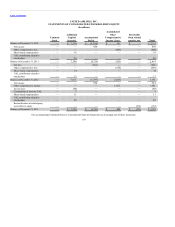
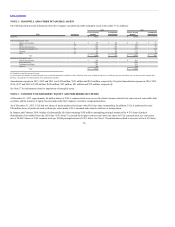
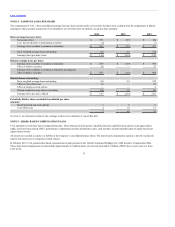
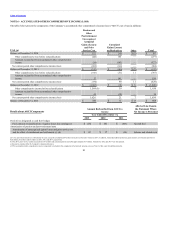
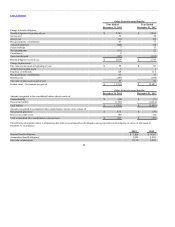
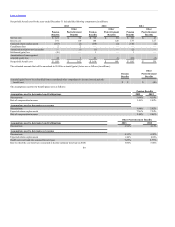
The table below summarizes UAL’s RSUs and restricted stock activity for the years ended December 31 (shares in millions):
Non-vested at December 31, 2010 — 1 $ 17.20
Granted 4 1 23.87
Vested — (1) 22.26
Surrendered (1) — 23.95
Non-vested at December 31, 2011 3 1 23.33
Granted 2 1 24.01
Vested — (1) 23.05
Surrendered (1) — 24.01
Non-vested at December 31, 2012 4 1 23.94
Granted 2 1 25.98
Vested (1) (1) 23.93
Surrendered — — 24.76
Non-vested at December 31, 2013 5 1 25.02
The fair value of RSUs and restricted stock vested in 2013, 2012 and 2011 was $22 million, $27 million and $7 million, respectively. The fair value of the
restricted stock awards was primarily based upon the UAL common stock price on the date of grant. These awards are accounted for as equity awards. The
fair value of the RSUs was based on the UAL common stock price as of the last day preceding the settlement date. These awards were accounted for as
liability awards. Restricted stock vesting and the recognition of the expense is similar to the stock option vesting described below.
Stock Options. UAL has not granted any stock options since 2010. Historically, stock options were awarded with exercise prices equal to the fair market
value of UAL’s common stock on the date of grant. UAL stock options generally vest over a period of either three or four years and have a contractual life of
10 years. The Continental stock options assumed by UAL at the Merger generally have an original contractual life of five years (management level employee
options) or 10 years (outside directors). Expense related to each portion of an option grant is recognized on a straight-line basis over the specific vesting period
for those options.
79