United Airlines 2013 Annual Report Download - page 58
Download and view the complete annual report
Please find page 58 of the 2013 United Airlines annual report below. You can navigate through the pages in the report by either clicking on the pages listed below, or by using the keyword search tool below to find specific information within the annual report.-
 1
1 -
2
-
3
-
4
-
5
-
6
-
7
-
8
-
9
-
10
-
11
-
12
-
13
-
14
-
15
-
16
-
17
-
18
-
19
-
20
-
21
-
22
-
23
-
24
-
25
-
26
-
27
-
28
-
29
-
30
-
31
-
32
-
33
-
34
-
35
-
36
-
37
-
38
-
39
-
40
-
41
-
42
-
43
-
44
-
45
-
46
-
47
-
 48
48 -
 49
49 -
 50
50 -
 51
51 -
 52
52 -
 53
53 -
 54
54 -
 55
55 -
 56
56 -
 57
57 -
 58
58 -
 59
59 -
 60
60 -
 61
61 -
 62
62 -
 63
63 -
 64
64 -
 65
65 -
 66
66 -
 67
67 -
 68
68 -
69
-
70
-
71
-
72
-
73
-
74
-
75
-
76
-
77
-
78
-
79
-
80
-
81
-
82
-
83
-
84
-
85
-
86
-
87
-
88
-
89
-
90
-
91
-
92
-
93
-
94
-
95
-
96
-
97
-
98
-
99
-
100
-
101
-
102
-
103
-
104
-
105
-
106
-
107
-
108
-
109
-
110
-
111
-
112
-
113
-
114
-
115
-
116
-
117
-
118
-
119
-
120
-
121
-
122
-
123
-
124
-
125
-
126
-
127
-
128
-
129
-
130
-
131
-
132
-
133
-
134
-
135
-
136
-
137
-
138
-
139
-
140
-
141
-
142
-
143
-
144
-
145
-
146
-
147
-
148
-
149
-
150
-
151
-
152
-
153
-
154
-
155
-
156
-
157
-
158
-
159
-
160
-
161
-
162
-
163
-
164
-
165
-
166
-
167
-
168
-
169
-
170
-
171
-
172
-
173
-
174
-
175
-
176
-
177
-
178
-
179
-
180
-
181
-
182
-
183
-
184
-
185
-
186
-
187
-
188
-
189
-
190
-
191
-
192
-
193
-
194
-
195
-
196
-
197
-
198
-
199
-
200
-
201
-
202
-
203
-
204
-
205
-
206
-
207
-
208
-
209
-
210
-
211
-
212
-
213
-
214
-
215
-
216
-
217
-
218
-
219
-
220
-
221
-
222
-
223
-
224
-
225
-
226
-
227
-
228
-
229
-
230
-
231
-
232
-
233
-
234
-
235
-
236
-
237
-
238
-
239
-
240
-
241
-
242
-
243
-
244
-
245
-
246
-
247
-
248
-
249
-
250
-
251
-
252
-
253
 |
 |

Table of Contents
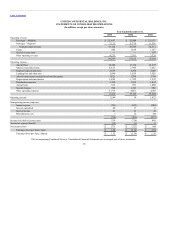
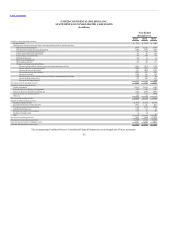
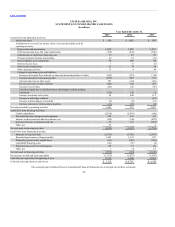
Operating revenue:
Passenger—Mainline $ 25,997 $ 25,804 $ 25,975
Passenger—Regional 7,125 6,779 6,536
Total passenger revenue 33,122 32,583 32,511
Cargo 882 1,018 1,167
Special revenue item — — 107
Other operating revenue 4,275 3,551 3,325
38,279 37,152 37,110
Operating expense:
Aircraft fuel 12,345 13,138 12,375
Salaries and related costs 8,625 7,945 7,652
Regional capacity purchase 2,419 2,470 2,403
Landing fees and other rent 2,090 1,929 1,928
Aircraft maintenance materials and outside repairs 1,821 1,760 1,744
Depreciation and amortization 1,689 1,522 1,547
Distribution expenses 1,390 1,352 1,435
Aircraft rent 936 993 1,009
Special charges 520 1,323 592
Other operating expenses 5,195 4,681 4,603
37,030 37,113 35,288
Operating income 1,249 39 1,822
Nonoperating income (expense):
Interest expense (783) (835) (949)
Interest capitalized 49 37 32
Interest income 21 23 20
Miscellaneous, net 3 12 (80)
(710) (763) (977)
Income (loss) before income taxes 539 (724) 845
Income tax expense (benefit) (32) (1) 5
Net income (loss) $ 571 $ (723) $ 840
Earnings (loss) per share, basic $ 1.64 $ (2.18) $ 2.54
Earnings (loss) per share, diluted $ 1.53 $ (2.18) $ 2.26
The accompanying Combined Notes to Consolidated Financial Statements are an integral part of these statements.
58