United Airlines 2013 Annual Report Download - page 39
Download and view the complete annual report
Please find page 39 of the 2013 United Airlines annual report below. You can navigate through the pages in the report by either clicking on the pages listed below, or by using the keyword search tool below to find specific information within the annual report.-
 1
1 -
2
-
3
-
4
-
5
-
6
-
7
-
8
-
9
-
10
-
11
-
12
-
13
-
14
-
15
-
16
-
17
-
18
-
19
-
20
-
21
-
22
-
23
-
24
-
25
-
26
-
27
-
28
-
 29
29 -
 30
30 -
 31
31 -
 32
32 -
 33
33 -
 34
34 -
 35
35 -
 36
36 -
 37
37 -
 38
38 -
 39
39 -
 40
40 -
 41
41 -
 42
42 -
 43
43 -
 44
44 -
 45
45 -
 46
46 -
 47
47 -
 48
48 -
 49
49 -
50
-
51
-
52
-
53
-
54
-
55
-
56
-
57
-
58
-
59
-
60
-
61
-
62
-
63
-
64
-
65
-
66
-
67
-
68
-
69
-
70
-
71
-
72
-
73
-
74
-
75
-
76
-
77
-
78
-
79
-
80
-
81
-
82
-
83
-
84
-
85
-
86
-
87
-
88
-
89
-
90
-
91
-
92
-
93
-
94
-
95
-
96
-
97
-
98
-
99
-
100
-
101
-
102
-
103
-
104
-
105
-
106
-
107
-
108
-
109
-
110
-
111
-
112
-
113
-
114
-
115
-
116
-
117
-
118
-
119
-
120
-
121
-
122
-
123
-
124
-
125
-
126
-
127
-
128
-
129
-
130
-
131
-
132
-
133
-
134
-
135
-
136
-
137
-
138
-
139
-
140
-
141
-
142
-
143
-
144
-
145
-
146
-
147
-
148
-
149
-
150
-
151
-
152
-
153
-
154
-
155
-
156
-
157
-
158
-
159
-
160
-
161
-
162
-
163
-
164
-
165
-
166
-
167
-
168
-
169
-
170
-
171
-
172
-
173
-
174
-
175
-
176
-
177
-
178
-
179
-
180
-
181
-
182
-
183
-
184
-
185
-
186
-
187
-
188
-
189
-
190
-
191
-
192
-
193
-
194
-
195
-
196
-
197
-
198
-
199
-
200
-
201
-
202
-
203
-
204
-
205
-
206
-
207
-
208
-
209
-
210
-
211
-
212
-
213
-
214
-
215
-
216
-
217
-
218
-
219
-
220
-
221
-
222
-
223
-
224
-
225
-
226
-
227
-
228
-
229
-
230
-
231
-
232
-
233
-
234
-
235
-
236
-
237
-
238
-
239
-
240
-
241
-
242
-
243
-
244
-
245
-
246
-
247
-
248
-
249
-
250
-
251
-
252
-
253
 |
 |

Table of Contents
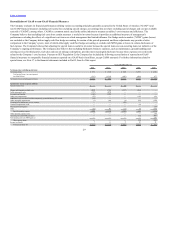
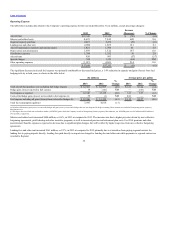
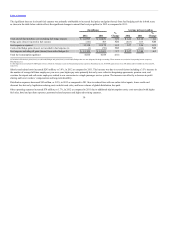
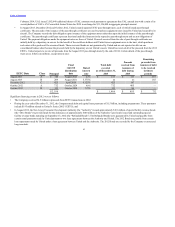
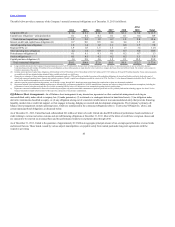
The significant increase in aircraft fuel expense was primarily attributable to increased fuel prices and gains (losses) from fuel hedging activity in both years,
as shown in the table below which reflects the significant changes in aircraft fuel cost per gallon for 2012 as compared to 2011.
Total aircraft fuel purchase cost excluding fuel hedge impacts $ 12,997 $ 12,878 0.9 $ 3.24 $3.19 1.6
Hedge gains (losses) reported in fuel expense (141) 503 NM (0.03) 0.13 NM
Fuel expense as reported 13,138 12,375 6.2 3.27 3.06 6.9
Cash-settled hedge gains (losses) not recorded in fuel expense (a) (1) (56) NM — (0.02) NM
Fuel expense including all gains (losses) from settled hedges (b) $ 13,139 $ 12,431 5.7 $3.27 $ 3.08 6.2
Total fuel consumption (gallons) 4,016 4,038 (0.5)
(a) Includes ineffectiveness gains (losses) on cash-settled hedges and gains (losses) on cash-settled hedges that were not designated for hedge accounting. These amounts are recorded in Nonoperating income (expense):
Miscellaneous, net.
(b) This figure does not include NCMTM gains (losses), which the Company records in Nonoperating income (expense): Miscellaneous, net. NCMTM gains (losses) were $38 million and $(3) million in 2012 and 2011,
respectively.
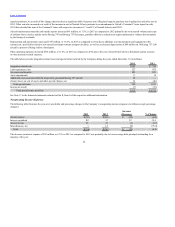
Salaries and related costs increased $293 million, or 3.8%, in 2012 as compared to 2011. The increase was due to several factors including a 3.5% increase in
the number of average full-time employees year-over-year, higher pay rates primarily driven by new collective bargaining agreements, pension costs, and
overtime for airport and call center employees related to our conversion to a single passenger service system. The increase was offset by a decrease in profit
sharing and lower workers’ compensation and long-term disability.
Distribution expenses decreased $83 million, or 5.8%, in 2012 as compared to 2011 due to reduced fees with our online ticket agents, lower credit card
discount fees driven by legislation reducing costs on debit card sales, and lower volume of global distribution fees paid.
Other operating expenses increased $78 million, or 1.7%, in 2012 as compared to 2011 due to additional trip interruption costs, costs associated with higher
fuel sales, hotel and per diem expenses, personnel-related expenses and higher advertising expenses.
39