United Airlines 2013 Annual Report Download - page 60
Download and view the complete annual report
Please find page 60 of the 2013 United Airlines annual report below. You can navigate through the pages in the report by either clicking on the pages listed below, or by using the keyword search tool below to find specific information within the annual report.-
 1
1 -
2
-
3
-
4
-
5
-
6
-
7
-
8
-
9
-
10
-
11
-
12
-
13
-
14
-
15
-
16
-
17
-
18
-
19
-
20
-
21
-
22
-
23
-
24
-
25
-
26
-
27
-
28
-
29
-
30
-
31
-
32
-
33
-
34
-
35
-
36
-
37
-
38
-
39
-
40
-
41
-
42
-
43
-
44
-
45
-
46
-
47
-
48
-
49
-
 50
50 -
 51
51 -
 52
52 -
 53
53 -
 54
54 -
 55
55 -
 56
56 -
 57
57 -
 58
58 -
 59
59 -
 60
60 -
 61
61 -
 62
62 -
 63
63 -
 64
64 -
 65
65 -
 66
66 -
 67
67 -
 68
68 -
 69
69 -
 70
70 -
71
-
72
-
73
-
74
-
75
-
76
-
77
-
78
-
79
-
80
-
81
-
82
-
83
-
84
-
85
-
86
-
87
-
88
-
89
-
90
-
91
-
92
-
93
-
94
-
95
-
96
-
97
-
98
-
99
-
100
-
101
-
102
-
103
-
104
-
105
-
106
-
107
-
108
-
109
-
110
-
111
-
112
-
113
-
114
-
115
-
116
-
117
-
118
-
119
-
120
-
121
-
122
-
123
-
124
-
125
-
126
-
127
-
128
-
129
-
130
-
131
-
132
-
133
-
134
-
135
-
136
-
137
-
138
-
139
-
140
-
141
-
142
-
143
-
144
-
145
-
146
-
147
-
148
-
149
-
150
-
151
-
152
-
153
-
154
-
155
-
156
-
157
-
158
-
159
-
160
-
161
-
162
-
163
-
164
-
165
-
166
-
167
-
168
-
169
-
170
-
171
-
172
-
173
-
174
-
175
-
176
-
177
-
178
-
179
-
180
-
181
-
182
-
183
-
184
-
185
-
186
-
187
-
188
-
189
-
190
-
191
-
192
-
193
-
194
-
195
-
196
-
197
-
198
-
199
-
200
-
201
-
202
-
203
-
204
-
205
-
206
-
207
-
208
-
209
-
210
-
211
-
212
-
213
-
214
-
215
-
216
-
217
-
218
-
219
-
220
-
221
-
222
-
223
-
224
-
225
-
226
-
227
-
228
-
229
-
230
-
231
-
232
-
233
-
234
-
235
-
236
-
237
-
238
-
239
-
240
-
241
-
242
-
243
-
244
-
245
-
246
-
247
-
248
-
249
-
250
-
251
-
252
-
253
 |
 |

Table of Contents
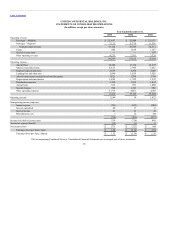
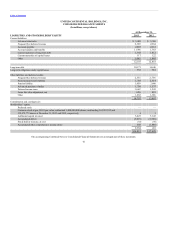
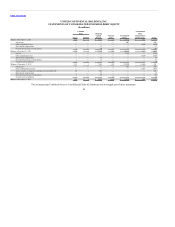
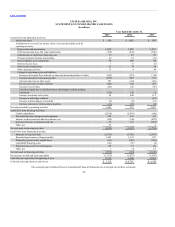
Current assets:
Cash and cash equivalents $ 3,220 $ 4,770
Short-term investments 1,901 1,773
Total unrestricted cash, cash equivalents and short-term investments 5,121 6,543
Restricted cash 31 65
Receivables, less allowance for doubtful accounts (2013—$13; 2012—$13) 1,503 1,338
Aircraft fuel, spare parts and supplies, less obsolescence allowance (2013—$162; 2012—$125) 667 695
Deferred income taxes 676 543
Prepaid expenses and other 704 865
8,702 10,049
Operating property and equipment:
Owned—
Flight equipment 18,786 17,561
Other property and equipment 3,687 3,269
22,473 20,830
Less—Accumulated depreciation and amortization (6,080) (5,006)
16,393 15,824
Purchase deposits for flight equipment 706 462
Capital leases—
Flight equipment 1,490 1,484
Other property and equipment 307 235
1,797 1,719
Less—Accumulated amortization (849) (713)
948 1,006
18,047 17,292
Other assets:
Goodwill 4,523 4,523
Intangibles, less accumulated amortization (2013—$933; 2012—$792) 4,436 4,597
Restricted cash 364 382
Other, net 740 785
10,063 10,287
$ 36,812 $ 37,628
(continued on next page)
60