United Airlines 2013 Annual Report Download - page 37
Download and view the complete annual report
Please find page 37 of the 2013 United Airlines annual report below. You can navigate through the pages in the report by either clicking on the pages listed below, or by using the keyword search tool below to find specific information within the annual report.-
 1
1 -
2
-
3
-
4
-
5
-
6
-
7
-
8
-
9
-
10
-
11
-
12
-
13
-
14
-
15
-
16
-
17
-
18
-
19
-
20
-
21
-
22
-
23
-
24
-
25
-
26
-
 27
27 -
 28
28 -
 29
29 -
 30
30 -
 31
31 -
 32
32 -
 33
33 -
 34
34 -
 35
35 -
 36
36 -
 37
37 -
 38
38 -
 39
39 -
 40
40 -
 41
41 -
 42
42 -
 43
43 -
 44
44 -
 45
45 -
 46
46 -
 47
47 -
48
-
49
-
50
-
51
-
52
-
53
-
54
-
55
-
56
-
57
-
58
-
59
-
60
-
61
-
62
-
63
-
64
-
65
-
66
-
67
-
68
-
69
-
70
-
71
-
72
-
73
-
74
-
75
-
76
-
77
-
78
-
79
-
80
-
81
-
82
-
83
-
84
-
85
-
86
-
87
-
88
-
89
-
90
-
91
-
92
-
93
-
94
-
95
-
96
-
97
-
98
-
99
-
100
-
101
-
102
-
103
-
104
-
105
-
106
-
107
-
108
-
109
-
110
-
111
-
112
-
113
-
114
-
115
-
116
-
117
-
118
-
119
-
120
-
121
-
122
-
123
-
124
-
125
-
126
-
127
-
128
-
129
-
130
-
131
-
132
-
133
-
134
-
135
-
136
-
137
-
138
-
139
-
140
-
141
-
142
-
143
-
144
-
145
-
146
-
147
-
148
-
149
-
150
-
151
-
152
-
153
-
154
-
155
-
156
-
157
-
158
-
159
-
160
-
161
-
162
-
163
-
164
-
165
-
166
-
167
-
168
-
169
-
170
-
171
-
172
-
173
-
174
-
175
-
176
-
177
-
178
-
179
-
180
-
181
-
182
-
183
-
184
-
185
-
186
-
187
-
188
-
189
-
190
-
191
-
192
-
193
-
194
-
195
-
196
-
197
-
198
-
199
-
200
-
201
-
202
-
203
-
204
-
205
-
206
-
207
-
208
-
209
-
210
-
211
-
212
-
213
-
214
-
215
-
216
-
217
-
218
-
219
-
220
-
221
-
222
-
223
-
224
-
225
-
226
-
227
-
228
-
229
-
230
-
231
-
232
-
233
-
234
-
235
-
236
-
237
-
238
-
239
-
240
-
241
-
242
-
243
-
244
-
245
-
246
-
247
-
248
-
249
-
250
-
251
-
252
-
253
 |
 |

Table of Contents
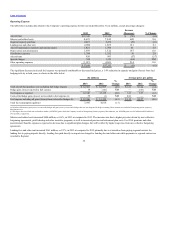
In 2013, miscellaneous, net included a gain of $84 million from fuel hedge derivatives as compared to a gain of $37 million in 2012.
United’s nonoperating expense also included a net gain of $70 million associated with marking to market the fair value of derivative assets and liabilities
related to agreements that provide for United’s convertible debt to be settled with UAL common stock as compared to a net gain of $42 million in 2012. This
net gain and related derivatives are reflected only in the United stand-alone financial statements as they are eliminated at the consolidated level. See Note 9 to
the financial statements included in Part II, Item 8 of this report for additional information.
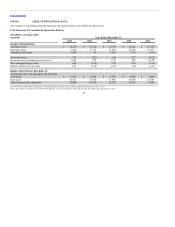
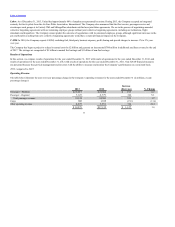
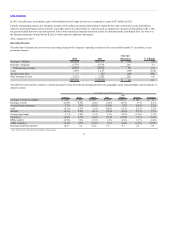
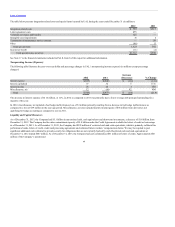
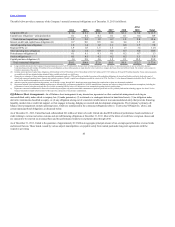
Operating Revenue
The table below illustrates the year-over-year percentage change in the Company’s operating revenues for the years ended December 31 (in millions, except
percentage changes):
Passenger—Mainline $25,804 $25,975 $ (171) (0.7)
Passenger—Regional 6,779 6,536 243 3.7
Total passenger revenue 32,583 32,511 72 0.2
Cargo 1,018 1,167 (149) (12.8)
Special revenue item — 107 (107) NM
Other operating revenue 3,551 3,325 226 6.8
$37,152 $ 37,110 $ 42 0.1
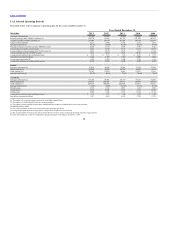
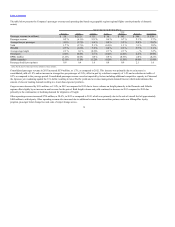
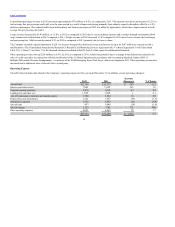
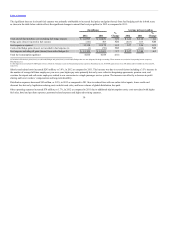
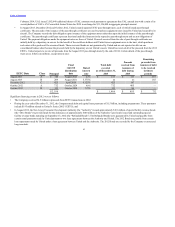
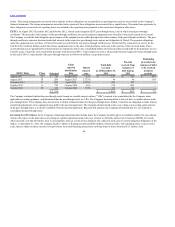
The table below presents the Company’s selected passenger revenue and selected operating data based on geographic region (regional flights consist primarily of
domestic routes):
Passenger revenue (in millions) $ (338) $ 391 $(197) $(27) $(171) $243 $ 72
Passenger revenue (2.6)% 8.6% (3.4)% (1.0)% (0.7)% 3.7 % 0.2 %
Average fare per passenger 1.5 % 2.3% (0.1)% (1.5)% 2.3% 0.6 % 1.2 %
Yield (0.1)% 5.1% 0.3 % (4.2)% 0.6 % 2.5 % 1.2 %
PRASM (0.3)% 5.8% 0.2 % (2.2)% 0.8 % 5.5 % 1.7 %
Average stage length 2.3 % 1.6% 0.3 % 3.1 % 2.8 % (2.3)% 1.1 %
Passengers (4.0)% 6.1% (3.4)% 0.5 % (2.9)% 3.1 % (1.0)%
RPMs (traffic) (2.5)% 3.2% (3.7)% 3.2 % (1.3)% 1.2 % (1.0)%
ASMs (capacity) (2.4)% 2.7% (3.6)% 1.3 % (1.4)% (1.7)% (1.5)%
Passenger load factor (points) (0.2) 0.4 (0.2) 1.6 0.1 2.2 0.4
(a) See Part II, Item 6 of this report for the definition of these statistics.
37