United Airlines 2013 Annual Report Download - page 77
Download and view the complete annual report
Please find page 77 of the 2013 United Airlines annual report below. You can navigate through the pages in the report by either clicking on the pages listed below, or by using the keyword search tool below to find specific information within the annual report.-
 1
1 -
2
-
3
-
4
-
5
-
6
-
7
-
8
-
9
-
10
-
11
-
12
-
13
-
14
-
15
-
16
-
17
-
18
-
19
-
20
-
21
-
22
-
23
-
24
-
25
-
26
-
27
-
28
-
29
-
30
-
31
-
32
-
33
-
34
-
35
-
36
-
37
-
38
-
39
-
40
-
41
-
42
-
43
-
44
-
45
-
46
-
47
-
48
-
49
-
50
-
51
-
52
-
53
-
54
-
55
-
56
-
57
-
58
-
59
-
60
-
61
-
62
-
63
-
64
-
65
-
66
-
 67
67 -
 68
68 -
 69
69 -
 70
70 -
 71
71 -
 72
72 -
 73
73 -
 74
74 -
 75
75 -
 76
76 -
 77
77 -
 78
78 -
 79
79 -
 80
80 -
 81
81 -
 82
82 -
 83
83 -
 84
84 -
 85
85 -
 86
86 -
 87
87 -
88
-
89
-
90
-
91
-
92
-
93
-
94
-
95
-
96
-
97
-
98
-
99
-
100
-
101
-
102
-
103
-
104
-
105
-
106
-
107
-
108
-
109
-
110
-
111
-
112
-
113
-
114
-
115
-
116
-
117
-
118
-
119
-
120
-
121
-
122
-
123
-
124
-
125
-
126
-
127
-
128
-
129
-
130
-
131
-
132
-
133
-
134
-
135
-
136
-
137
-
138
-
139
-
140
-
141
-
142
-
143
-
144
-
145
-
146
-
147
-
148
-
149
-
150
-
151
-
152
-
153
-
154
-
155
-
156
-
157
-
158
-
159
-
160
-
161
-
162
-
163
-
164
-
165
-
166
-
167
-
168
-
169
-
170
-
171
-
172
-
173
-
174
-
175
-
176
-
177
-
178
-
179
-
180
-
181
-
182
-
183
-
184
-
185
-
186
-
187
-
188
-
189
-
190
-
191
-
192
-
193
-
194
-
195
-
196
-
197
-
198
-
199
-
200
-
201
-
202
-
203
-
204
-
205
-
206
-
207
-
208
-
209
-
210
-
211
-
212
-
213
-
214
-
215
-
216
-
217
-
218
-
219
-
220
-
221
-
222
-
223
-
224
-
225
-
226
-
227
-
228
-
229
-
230
-
231
-
232
-
233
-
234
-
235
-
236
-
237
-
238
-
239
-
240
-
241
-
242
-
243
-
244
-
245
-
246
-
247
-
248
-
249
-
250
-
251
-
252
-
253
 |
 |

Table of Contents
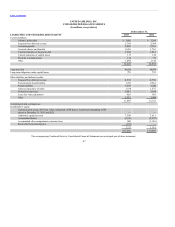
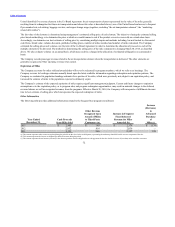
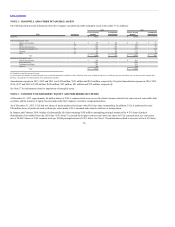
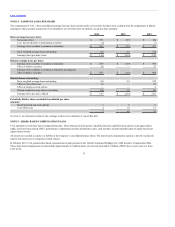
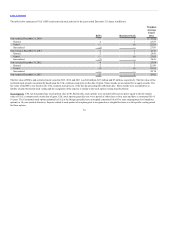
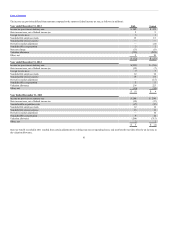
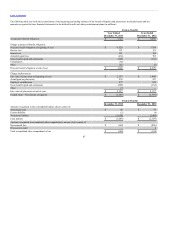
The computations of UAL’s basic and diluted earnings (loss) per share and the number of securities that have been excluded from the computation of diluted
earnings per share amounts because they were antidilutive are set forth below (in millions, except per share amounts):
Net income (loss) $ 571 $ (723) $ 840
Less: Income allocable to participating securities (2) — (3)
Earnings (loss) available to common stockholders $ 569 $ (723) $ 837
Basic weighted-average shares outstanding 348 331 329
Earnings (loss) per share, basic $ 1.64 $ (2.18) $ 2.54
Earnings (loss) available to common stockholders $ 569 $ (723) $ 837
Effect of dilutive securities 26 — 27
Earnings (loss) available to common stockholders including the
effect of dilutive securities $ 595 $ (723) $ 864
Basic weighted-average shares outstanding 348 331 329
Effect of convertible notes 42 — 52
Effect of employee stock options — — 2
Diluted weighted-average shares outstanding 390 331 383
Earnings (loss) per share, diluted $ 1.53 $ (2.18) $ 2.26
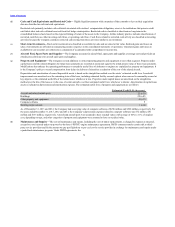
Restricted stock and stock options 3 5 6
Convertible notes 4 61 15
7 66 21
See Note 11 for information related to the exchange of shares for redemption of convertible debt.
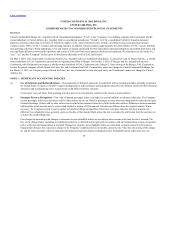
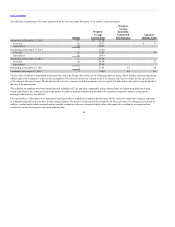
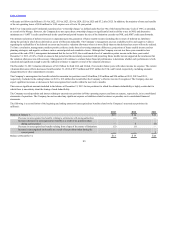
UAL maintains several share-based compensation plans. These plans provide for grants of qualified and non-qualified stock options, stock appreciation
rights, restricted stock awards, RSUs, performance compensation awards, performance units, cash incentive awards and other types of equity-based and
equity-related awards.
All awards are recorded as equity or a liability in the Company’s consolidated balance sheets. The share-based compensation expense is directly recorded in
salaries and related costs or integration-related expense.
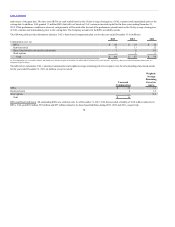
In February 2013, UAL granted share-based compensation awards pursuant to the United Continental Holdings, Inc. 2008 Incentive Compensation Plan.
These share-based compensation awards include approximately 0.5 million shares of restricted stock and 0.5 million of RSUs that vest pro-rata over three
years on the
77