United Airlines 2013 Annual Report Download - page 34
Download and view the complete annual report
Please find page 34 of the 2013 United Airlines annual report below. You can navigate through the pages in the report by either clicking on the pages listed below, or by using the keyword search tool below to find specific information within the annual report.-
 1
1 -
2
-
3
-
4
-
5
-
6
-
7
-
8
-
9
-
10
-
11
-
12
-
13
-
14
-
15
-
16
-
17
-
18
-
19
-
20
-
21
-
22
-
23
-
 24
24 -
 25
25 -
 26
26 -
 27
27 -
 28
28 -
 29
29 -
 30
30 -
 31
31 -
 32
32 -
 33
33 -
 34
34 -
 35
35 -
 36
36 -
 37
37 -
 38
38 -
 39
39 -
 40
40 -
 41
41 -
 42
42 -
 43
43 -
 44
44 -
45
-
46
-
47
-
48
-
49
-
50
-
51
-
52
-
53
-
54
-
55
-
56
-
57
-
58
-
59
-
60
-
61
-
62
-
63
-
64
-
65
-
66
-
67
-
68
-
69
-
70
-
71
-
72
-
73
-
74
-
75
-
76
-
77
-
78
-
79
-
80
-
81
-
82
-
83
-
84
-
85
-
86
-
87
-
88
-
89
-
90
-
91
-
92
-
93
-
94
-
95
-
96
-
97
-
98
-
99
-
100
-
101
-
102
-
103
-
104
-
105
-
106
-
107
-
108
-
109
-
110
-
111
-
112
-
113
-
114
-
115
-
116
-
117
-
118
-
119
-
120
-
121
-
122
-
123
-
124
-
125
-
126
-
127
-
128
-
129
-
130
-
131
-
132
-
133
-
134
-
135
-
136
-
137
-
138
-
139
-
140
-
141
-
142
-
143
-
144
-
145
-
146
-
147
-
148
-
149
-
150
-
151
-
152
-
153
-
154
-
155
-
156
-
157
-
158
-
159
-
160
-
161
-
162
-
163
-
164
-
165
-
166
-
167
-
168
-
169
-
170
-
171
-
172
-
173
-
174
-
175
-
176
-
177
-
178
-
179
-
180
-
181
-
182
-
183
-
184
-
185
-
186
-
187
-
188
-
189
-
190
-
191
-
192
-
193
-
194
-
195
-
196
-
197
-
198
-
199
-
200
-
201
-
202
-
203
-
204
-
205
-
206
-
207
-
208
-
209
-
210
-
211
-
212
-
213
-
214
-
215
-
216
-
217
-
218
-
219
-
220
-
221
-
222
-
223
-
224
-
225
-
226
-
227
-
228
-
229
-
230
-
231
-
232
-
233
-
234
-
235
-
236
-
237
-
238
-
239
-
240
-
241
-
242
-
243
-
244
-
245
-
246
-
247
-
248
-
249
-
250
-
251
-
252
-
253
 |
 |

Table of Contents
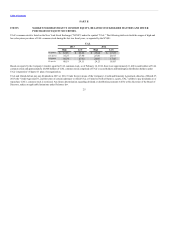
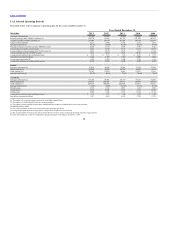
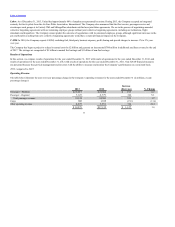
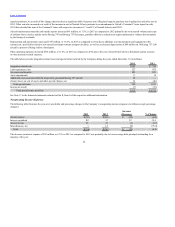
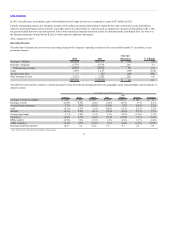
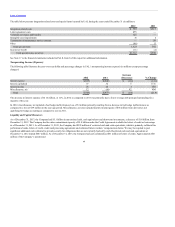
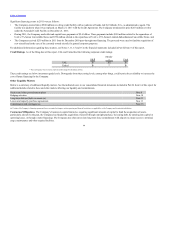
The table below presents the Company’s passenger revenues and operating data based on geographic region (regional flights consist primarily of domestic
routes):
Passenger revenue (in millions) $ 58 $(212) $331 $16 $ 193 $346 $ 539
Passenger revenue 0.5 % (4.3)% 5.9 % 0.6 % 0.7 % 5.1 % 1.7 %
Average fare per passenger 4.0 % (3.7)% 4.4 % 0.8 % 3.2 % 2.8 % 2.6 %
Yield 1.7 % (3.7)% 5.1 % (0.2)% 1.3 % 3.1 % 1.8 %
PRASM 2.7 % (3.2)% 7.2 % 0.8 % 2.3 % 5.7 % 3.1 %
Average stage length 2.3 % 0.3 % (0.6)% 2.1 % 2.1 % — % 1.2 %
Passengers (3.4)% (0.5)% 1.5 % (0.2)% (2.4)% 2.2 % (0.9)%
RPMs (traffic) (1.2)% (0.5)% 0.8 % 0.8 % (0.5)% 2.0 % (0.2)%
ASMs (capacity) (2.1)% (1.1)% (1.2)% (0.2)% (1.5)% (0.6)% (1.4)%
Passenger load factor (points) 0.8 0.4 1.6 0.8 0.9 2.1 1.0
(a) See Part II, Item 6 of this report for the definition of these statistics.
Consolidated passenger revenue in 2013 increased $539 million, or 1.7%, as compared to 2012. This increase was primarily due to an increase in
consolidated yield of 1.8% and an increase in average fare per passenger of 2.6%, offset in part by a decline in capacity of 1.4% and a reduction in traffic of
0.2% as compared to the year-ago period. Consolidated passenger revenue was also impacted by factors including additional competitive capacity in China and
the Japanese yen weakening against the U.S. dollar, resulting in lower Pacific yields and a revenue management demand forecast which underestimated the
amount of close-in booking demand resulting in a lower-than-expected yield mix.
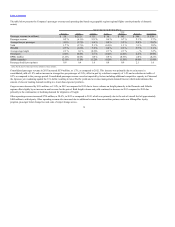
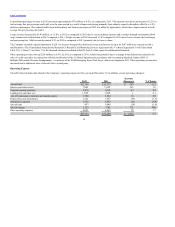
Cargo revenue decreased by $136 million, or 13.4%, in 2013 as compared to 2012 due to lower volumes on freight primarily in the Domestic and Atlantic
regions offset slightly by an increase in mail revenue for the period. Both freight volume and yield continued to decrease in 2013 compared to 2012 due
primarily to the continuation of declining demand for shipments of freight.
Other operating revenue increased $724 million, or 20.4%, in 2013 as compared to 2012, which was primarily due to the sale of aircraft fuel of approximately
$400 million to a third party. Other operating revenue also increased due to additional revenue from non-airline partners under our MileagePlus loyalty
program, passenger ticket change fees and sales of airport lounge access.
34