United Airlines 2013 Annual Report Download - page 76
Download and view the complete annual report
Please find page 76 of the 2013 United Airlines annual report below. You can navigate through the pages in the report by either clicking on the pages listed below, or by using the keyword search tool below to find specific information within the annual report.-
 1
1 -
2
-
3
-
4
-
5
-
6
-
7
-
8
-
9
-
10
-
11
-
12
-
13
-
14
-
15
-
16
-
17
-
18
-
19
-
20
-
21
-
22
-
23
-
24
-
25
-
26
-
27
-
28
-
29
-
30
-
31
-
32
-
33
-
34
-
35
-
36
-
37
-
38
-
39
-
40
-
41
-
42
-
43
-
44
-
45
-
46
-
47
-
48
-
49
-
50
-
51
-
52
-
53
-
54
-
55
-
56
-
57
-
58
-
59
-
60
-
61
-
62
-
63
-
64
-
65
-
 66
66 -
 67
67 -
 68
68 -
 69
69 -
 70
70 -
 71
71 -
 72
72 -
 73
73 -
 74
74 -
 75
75 -
 76
76 -
 77
77 -
 78
78 -
 79
79 -
 80
80 -
 81
81 -
 82
82 -
 83
83 -
 84
84 -
 85
85 -
 86
86 -
87
-
88
-
89
-
90
-
91
-
92
-
93
-
94
-
95
-
96
-
97
-
98
-
99
-
100
-
101
-
102
-
103
-
104
-
105
-
106
-
107
-
108
-
109
-
110
-
111
-
112
-
113
-
114
-
115
-
116
-
117
-
118
-
119
-
120
-
121
-
122
-
123
-
124
-
125
-
126
-
127
-
128
-
129
-
130
-
131
-
132
-
133
-
134
-
135
-
136
-
137
-
138
-
139
-
140
-
141
-
142
-
143
-
144
-
145
-
146
-
147
-
148
-
149
-
150
-
151
-
152
-
153
-
154
-
155
-
156
-
157
-
158
-
159
-
160
-
161
-
162
-
163
-
164
-
165
-
166
-
167
-
168
-
169
-
170
-
171
-
172
-
173
-
174
-
175
-
176
-
177
-
178
-
179
-
180
-
181
-
182
-
183
-
184
-
185
-
186
-
187
-
188
-
189
-
190
-
191
-
192
-
193
-
194
-
195
-
196
-
197
-
198
-
199
-
200
-
201
-
202
-
203
-
204
-
205
-
206
-
207
-
208
-
209
-
210
-
211
-
212
-
213
-
214
-
215
-
216
-
217
-
218
-
219
-
220
-
221
-
222
-
223
-
224
-
225
-
226
-
227
-
228
-
229
-
230
-
231
-
232
-
233
-
234
-
235
-
236
-
237
-
238
-
239
-
240
-
241
-
242
-
243
-
244
-
245
-
246
-
247
-
248
-
249
-
250
-
251
-
252
-
253
 |
 |
Table of Contents
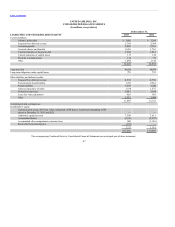
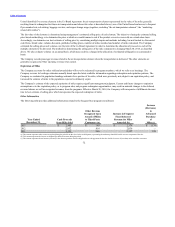
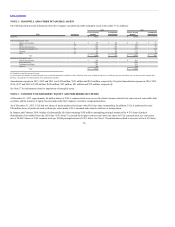
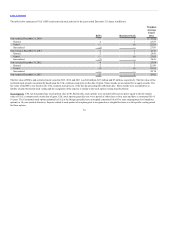
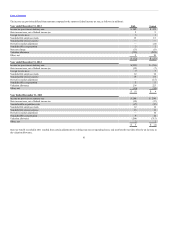
The following table presents information about the Company’s goodwill and other intangible assets at December 31 (in millions):
Goodwill $ 4,523 $ 4,523
Finite-lived intangible assets
Airport slots and gates 8 $ 98 $ 88 $ 99 $ 75
Hubs 20 145 59 145 52
Patents and tradenames 3 108 108 108 99
Frequent flyer database (b) 22 1,177 536 1,177 447
Contracts 13 167 86 167 75
Other 25 109 56 109 44
Total $ 1,804 $ 933 $ 1,805 $ 792
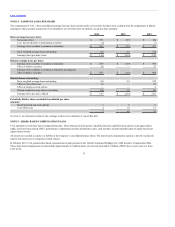
Indefinite-lived intangible assets
Airport slots and gates $ 963 $ 981
Route authorities 1,605 1,606
Tradenames and logos 593 593
Alliances 404 404
Total $ 3,565 $ 3,584
(a) Weighted average life expressed in years.
(b) The frequent flyer database is amortized based on an accelerated amortization schedule to reflect utilization of the assets. Estimated cash flows correlating to the expected attrition rate of customers in the frequent flyer
database is considered in the determination of the amortization schedules.
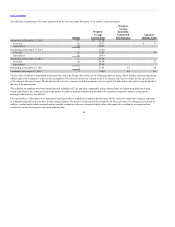
Amortization expense in 2013, 2012 and 2011 was $142 million, $121 million and $169 million, respectively. Projected amortization expense in 2014, 2015,
2016, 2017 and 2018 is $128 million, $106 million, $92 million, $81 million and $72 million, respectively.
See Note 17 for information related to impairment of intangible assets.
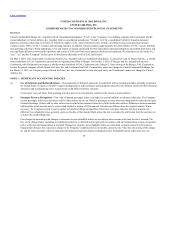
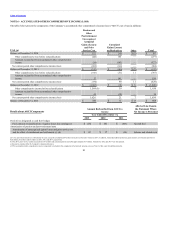
At December 31, 2013, approximately 44 million shares of UAL’s common stock were reserved for future issuance related to the conversion of convertible debt
securities and the issuance of equity based awards under the Company’s incentive compensation plans.
As of December 31, 2013, UAL had two shares of junior preferred stock (par value $0.01 per share) outstanding. In addition, UAL is authorized to issue
250 million shares of preferred stock (without par value) under UAL’s amended and restated certificate of incorporation.
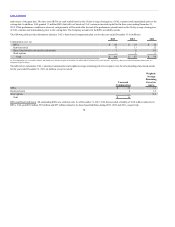
In January and February 2014, holders of substantially all of the remaining $156 million outstanding principal amount of the 4.5% Senior Limited-
Subordination Convertible Notes due 2021 (the “4.5% Notes”) exercised their right to convert such notes into shares of UAL common stock at a conversion
rate of 30.6419 shares of UAL common stock per $1,000 principal amount of 4.5% Notes. See Note 11 for information related to exercises of the 4.5% Notes.
76