United Airlines 2013 Annual Report Download - page 40
Download and view the complete annual report
Please find page 40 of the 2013 United Airlines annual report below. You can navigate through the pages in the report by either clicking on the pages listed below, or by using the keyword search tool below to find specific information within the annual report.-
 1
1 -
2
-
3
-
4
-
5
-
6
-
7
-
8
-
9
-
10
-
11
-
12
-
13
-
14
-
15
-
16
-
17
-
18
-
19
-
20
-
21
-
22
-
23
-
24
-
25
-
26
-
27
-
28
-
29
-
 30
30 -
 31
31 -
 32
32 -
 33
33 -
 34
34 -
 35
35 -
 36
36 -
 37
37 -
 38
38 -
 39
39 -
 40
40 -
 41
41 -
 42
42 -
 43
43 -
 44
44 -
 45
45 -
 46
46 -
 47
47 -
 48
48 -
 49
49 -
 50
50 -
51
-
52
-
53
-
54
-
55
-
56
-
57
-
58
-
59
-
60
-
61
-
62
-
63
-
64
-
65
-
66
-
67
-
68
-
69
-
70
-
71
-
72
-
73
-
74
-
75
-
76
-
77
-
78
-
79
-
80
-
81
-
82
-
83
-
84
-
85
-
86
-
87
-
88
-
89
-
90
-
91
-
92
-
93
-
94
-
95
-
96
-
97
-
98
-
99
-
100
-
101
-
102
-
103
-
104
-
105
-
106
-
107
-
108
-
109
-
110
-
111
-
112
-
113
-
114
-
115
-
116
-
117
-
118
-
119
-
120
-
121
-
122
-
123
-
124
-
125
-
126
-
127
-
128
-
129
-
130
-
131
-
132
-
133
-
134
-
135
-
136
-
137
-
138
-
139
-
140
-
141
-
142
-
143
-
144
-
145
-
146
-
147
-
148
-
149
-
150
-
151
-
152
-
153
-
154
-
155
-
156
-
157
-
158
-
159
-
160
-
161
-
162
-
163
-
164
-
165
-
166
-
167
-
168
-
169
-
170
-
171
-
172
-
173
-
174
-
175
-
176
-
177
-
178
-
179
-
180
-
181
-
182
-
183
-
184
-
185
-
186
-
187
-
188
-
189
-
190
-
191
-
192
-
193
-
194
-
195
-
196
-
197
-
198
-
199
-
200
-
201
-
202
-
203
-
204
-
205
-
206
-
207
-
208
-
209
-
210
-
211
-
212
-
213
-
214
-
215
-
216
-
217
-
218
-
219
-
220
-
221
-
222
-
223
-
224
-
225
-
226
-
227
-
228
-
229
-
230
-
231
-
232
-
233
-
234
-
235
-
236
-
237
-
238
-
239
-
240
-
241
-
242
-
243
-
244
-
245
-
246
-
247
-
248
-
249
-
250
-
251
-
252
-
253
 |
 |

Table of Contents
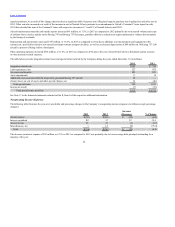
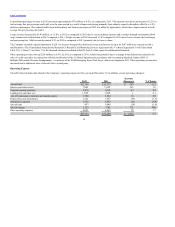
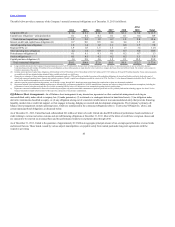
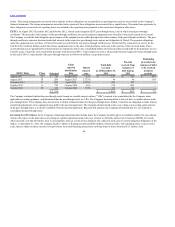
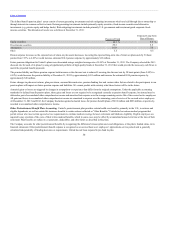
The table below presents integration-related costs and special items incurred by UAL during the years ended December 31 (in millions):
Integration-related costs $ 739 $517
Labor agreement costs 475 —
Voluntary severance and benefits 125 —
Intangible asset impairments 30 4
Termination of maintenance service contract — 58
Other (46) 13
Total special items 1,323 592
Income tax benefit (11) (2)
Total special items, net of tax $1,312 $590
See Note 17 to the financial statements included in Part II, Item 8 of this report for additional information.
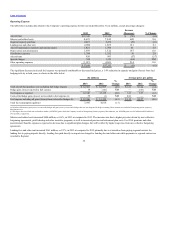
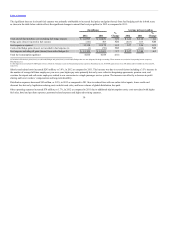
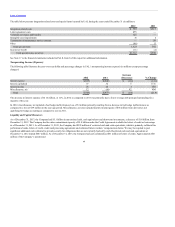
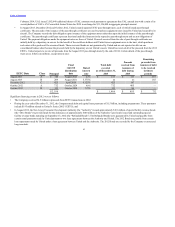
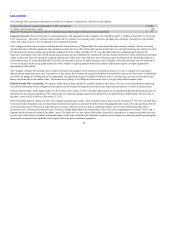
Nonoperating Income (Expense)
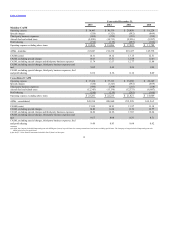
The following table illustrates the year-over-year dollar and percentage changes in UAL’s nonoperating income (expense) (in millions except percentage
changes):
Interest expense $(835) $(949) $ (114) (12.0)
Interest capitalized 37 32 5 15.6
Interest income 23 20 3 15.0
Miscellaneous, net 12 (80) 92 NM
Total $(763) $(977) $ (214) (21.9)
The decrease in interest expense of $114 million, or 12%, in 2012 as compared to 2011 was primarily due to lower average debt principal outstanding for a
majority of the year.
In 2012, miscellaneous, net included a fuel hedge ineffectiveness loss of $1 million primarily resulting from a decrease in fuel hedge ineffectiveness as
compared to a loss of $59 million in the year-ago period. Miscellaneous, net also included mark-to-market gains of $38 million from derivatives not
qualifying for hedge accounting as compared to zero in 2011.
Liquidity and Capital Resources
As of December 31, 2013, the Company had $5.1 billion in unrestricted cash, cash equivalents and short-term investments, a decrease of $1.4 billion from
December 31, 2012. The Company had its entire commitment capacity of $1.0 billion under the Credit Agreement available for letters of credit or borrowings
as of December 31, 2013. As of December 31, 2013, the Company had $395 million of restricted cash and cash equivalents, which is primarily collateral for
performance bonds, letters of credit, credit card processing agreements and estimated future workers’ compensation claims. We may be required to post
significant additional cash collateral to provide security for obligations that are not currently backed by cash. Restricted cash and cash equivalents at
December 31, 2012 totaled $447 million. As of December 31, 2013, the Company had cash collateralized $61 million of letters of credit. Approximately $80
million of the Company’s unrestricted
40