United Airlines 2013 Annual Report Download - page 68
Download and view the complete annual report
Please find page 68 of the 2013 United Airlines annual report below. You can navigate through the pages in the report by either clicking on the pages listed below, or by using the keyword search tool below to find specific information within the annual report.-
 1
1 -
2
-
3
-
4
-
5
-
6
-
7
-
8
-
9
-
10
-
11
-
12
-
13
-
14
-
15
-
16
-
17
-
18
-
19
-
20
-
21
-
22
-
23
-
24
-
25
-
26
-
27
-
28
-
29
-
30
-
31
-
32
-
33
-
34
-
35
-
36
-
37
-
38
-
39
-
40
-
41
-
42
-
43
-
44
-
45
-
46
-
47
-
48
-
49
-
50
-
51
-
52
-
53
-
54
-
55
-
56
-
57
-
 58
58 -
 59
59 -
 60
60 -
 61
61 -
 62
62 -
 63
63 -
 64
64 -
 65
65 -
 66
66 -
 67
67 -
 68
68 -
 69
69 -
 70
70 -
 71
71 -
 72
72 -
 73
73 -
 74
74 -
 75
75 -
 76
76 -
 77
77 -
 78
78 -
79
-
80
-
81
-
82
-
83
-
84
-
85
-
86
-
87
-
88
-
89
-
90
-
91
-
92
-
93
-
94
-
95
-
96
-
97
-
98
-
99
-
100
-
101
-
102
-
103
-
104
-
105
-
106
-
107
-
108
-
109
-
110
-
111
-
112
-
113
-
114
-
115
-
116
-
117
-
118
-
119
-
120
-
121
-
122
-
123
-
124
-
125
-
126
-
127
-
128
-
129
-
130
-
131
-
132
-
133
-
134
-
135
-
136
-
137
-
138
-
139
-
140
-
141
-
142
-
143
-
144
-
145
-
146
-
147
-
148
-
149
-
150
-
151
-
152
-
153
-
154
-
155
-
156
-
157
-
158
-
159
-
160
-
161
-
162
-
163
-
164
-
165
-
166
-
167
-
168
-
169
-
170
-
171
-
172
-
173
-
174
-
175
-
176
-
177
-
178
-
179
-
180
-
181
-
182
-
183
-
184
-
185
-
186
-
187
-
188
-
189
-
190
-
191
-
192
-
193
-
194
-
195
-
196
-
197
-
198
-
199
-
200
-
201
-
202
-
203
-
204
-
205
-
206
-
207
-
208
-
209
-
210
-
211
-
212
-
213
-
214
-
215
-
216
-
217
-
218
-
219
-
220
-
221
-
222
-
223
-
224
-
225
-
226
-
227
-
228
-
229
-
230
-
231
-
232
-
233
-
234
-
235
-
236
-
237
-
238
-
239
-
240
-
241
-
242
-
243
-
244
-
245
-
246
-
247
-
248
-
249
-
250
-
251
-
252
-
253
 |
 |

Table of Contents
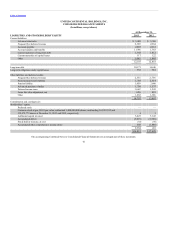
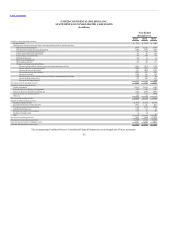
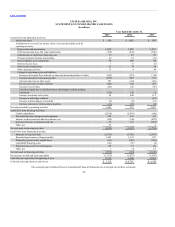
Cash Flows from Operating Activities:
Net income (loss) $ 654 $ (661) $ 850
Adjustments to reconcile net income (loss) to net cash provided (used) by
operating activities -
Depreciation and amortization 1,689 1,522 1,547
Debt discount and lease fair value amortization (178) (239) (186)
Amortization of capitalized financing costs 73 52 52
Pension and postretirement amortization 42 18 (23)
Special charges, non-cash portion 50 389 46
Deferred income taxes 1 13 (5)
Share-based compensation 11 14 18
Other operating activities 11 4 48
Changes in operating assets and liabilities -
Decrease in frequent flyer deferred revenue and advanced purchase of miles (415) (712) (110)
Increase (decrease) in accounts payable (265) 285 177
(Increase) decrease in other assets 163 (484) (200)
Increase (decrease) in other liabilities (203) 422 263
Increase in receivables (142) (21) (87)
Unrealized (gain) loss on fuel derivatives and change in related pending
settlements (56) 120 (2)
Increase in advance ticket sales 45 246 115
Increase in fuel hedge collateral — — (59)
Increase in intercompany receivables (5) (9) (83)
Increase (decrease) in intercompany payables (34) (28) 46
Net cash provided by operating activities 1,441 931 2,407
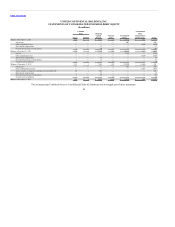
Cash Flows from Investing Activities:
Capital expenditures (2,164) (2,016) (840)
Proceeds from sale of property and equipment 152 183 123
Increase in short-term and other investments, net (120) (240) (898)
(Increase) decrease in restricted cash, net 52 121 (185)
Other, net 57 — 2
Net cash used in investing activities (2,023) (1,952) (1,798)
Cash Flows from Financing Activities:
Payments of long-term debt (2,185) (1,392) (2,367)
Proceeds from issuance of long-term debt 1,423 1,121 152
Principal payments under capital leases (134) (125) (250)
Capitalized financing costs (103) (71) (8)
Proceeds from exercise of stock options 29 17 26
Other, net 1 (4) 15
Net cash used in financing activities (969) (454) (2,432)
Net decrease in cash and cash equivalents (1,551) (1,475) (1,823)
Cash and cash equivalents at beginning of year 4,765 6,240 8,063
Cash and cash equivalents at end of year $ 3,214 $ 4,765 $ 6,240
The accompanying Combined Notes to Consolidated Financial Statements are an integral part of these statements.
68