United Airlines 2013 Annual Report Download - page 72
Download and view the complete annual report
Please find page 72 of the 2013 United Airlines annual report below. You can navigate through the pages in the report by either clicking on the pages listed below, or by using the keyword search tool below to find specific information within the annual report.-
 1
1 -
2
-
3
-
4
-
5
-
6
-
7
-
8
-
9
-
10
-
11
-
12
-
13
-
14
-
15
-
16
-
17
-
18
-
19
-
20
-
21
-
22
-
23
-
24
-
25
-
26
-
27
-
28
-
29
-
30
-
31
-
32
-
33
-
34
-
35
-
36
-
37
-
38
-
39
-
40
-
41
-
42
-
43
-
44
-
45
-
46
-
47
-
48
-
49
-
50
-
51
-
52
-
53
-
54
-
55
-
56
-
57
-
58
-
59
-
60
-
61
-
 62
62 -
 63
63 -
 64
64 -
 65
65 -
 66
66 -
 67
67 -
 68
68 -
 69
69 -
 70
70 -
 71
71 -
 72
72 -
 73
73 -
 74
74 -
 75
75 -
 76
76 -
 77
77 -
 78
78 -
 79
79 -
 80
80 -
 81
81 -
 82
82 -
83
-
84
-
85
-
86
-
87
-
88
-
89
-
90
-
91
-
92
-
93
-
94
-
95
-
96
-
97
-
98
-
99
-
100
-
101
-
102
-
103
-
104
-
105
-
106
-
107
-
108
-
109
-
110
-
111
-
112
-
113
-
114
-
115
-
116
-
117
-
118
-
119
-
120
-
121
-
122
-
123
-
124
-
125
-
126
-
127
-
128
-
129
-
130
-
131
-
132
-
133
-
134
-
135
-
136
-
137
-
138
-
139
-
140
-
141
-
142
-
143
-
144
-
145
-
146
-
147
-
148
-
149
-
150
-
151
-
152
-
153
-
154
-
155
-
156
-
157
-
158
-
159
-
160
-
161
-
162
-
163
-
164
-
165
-
166
-
167
-
168
-
169
-
170
-
171
-
172
-
173
-
174
-
175
-
176
-
177
-
178
-
179
-
180
-
181
-
182
-
183
-
184
-
185
-
186
-
187
-
188
-
189
-
190
-
191
-
192
-
193
-
194
-
195
-
196
-
197
-
198
-
199
-
200
-
201
-
202
-
203
-
204
-
205
-
206
-
207
-
208
-
209
-
210
-
211
-
212
-
213
-
214
-
215
-
216
-
217
-
218
-
219
-
220
-
221
-
222
-
223
-
224
-
225
-
226
-
227
-
228
-
229
-
230
-
231
-
232
-
233
-
234
-
235
-
236
-
237
-
238
-
239
-
240
-
241
-
242
-
243
-
244
-
245
-
246
-
247
-
248
-
249
-
250
-
251
-
252
-
253
 |
 |

Table of Contents
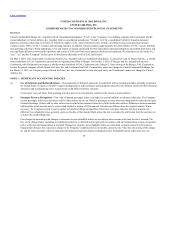
United identified five revenue elements in the Co-Brand Agreement: the air transportation element represented by the value of the mile (generally
resulting from its redemption for future air transportation and whose fair value is described above); use of the United brand and access to frequent
flyer member lists; advertising; baggage services; and airport lounge usage (together, excluding “the air transportation element”, the “marketing-
related deliverables”).
The fair value of the elements is determined using management’s estimated selling price of each element. The objective of using the estimated selling
price based methodology is to determine the price at which we would transact a sale if the product or service were sold on a stand-alone basis.
Accordingly, we determine our best estimate of selling price by considering multiple inputs and methods including, but not limited to, discounted
cash flows, brand value, volume discounts, published selling prices, number of miles awarded and number of miles redeemed. The Company
estimated the selling prices and volumes over the term of the Co-Brand Agreement in order to determine the allocation of proceeds to each of the
multiple elements to be delivered. The method for determining the selling price of the mile component is changing March 30, 2014, as described
above. We also evaluate volumes on an annual basis, which may result in a change in the allocation of estimated selling price on a prospective
basis.
The Company records passenger revenue related to the air transportation element when the transportation is delivered. The other elements are
generally recognized as Other operating revenue when earned.
The Company accounts for miles sold and awarded that will never be redeemed by program members, which we refer to as breakage. The
Company reviews its breakage estimates annually based upon the latest available information regarding redemption and expiration patterns. The
Company re-evaluated its population breakage estimates for a portion of its miles, which were previously not subject to an expiration policy, and
increased the estimate of miles in the population expected to ultimately expire.
The Company’s estimate of the expected expiration of miles requires significant management judgment. Current and future changes to expiration
assumptions or to the expiration policy, or to program rules and program redemption opportunities, may result in material changes to the deferred
revenue balance as well as recognized revenues from the programs. Effective March 30, 2014, the Company will incorporate a fulfillment discount
into its best estimate of selling price which incorporates the expected redemption of miles.
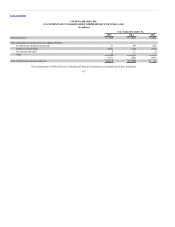
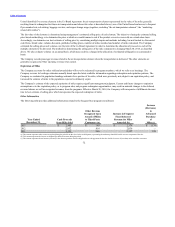
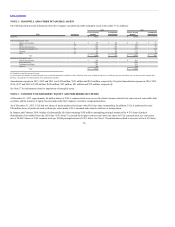
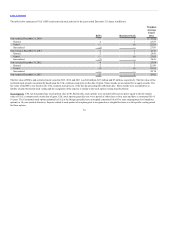
The following table provides additional information related to the frequent flyer program (in millions):
2013 $ 2,903 $ 903 $ 2,174 $ (174)
2012 2,852 816 2,036 —
2011 3,121 566 2,357 198
(a) This amount represents other revenue recognized during the period from the sale of miles to third parties, representing the marketing-related deliverable services component of the sale.
(b) This amount represents the increase to frequent flyer deferred revenue during the period.
(c) This amount represents the net increase (decrease) in the advance purchase of miles obligation due to cash payments for the sale of miles in excess of (less than) miles awarded to customers.
72