United Airlines 2013 Annual Report Download - page 81
Download and view the complete annual report
Please find page 81 of the 2013 United Airlines annual report below. You can navigate through the pages in the report by either clicking on the pages listed below, or by using the keyword search tool below to find specific information within the annual report.-
 1
1 -
2
-
3
-
4
-
5
-
6
-
7
-
8
-
9
-
10
-
11
-
12
-
13
-
14
-
15
-
16
-
17
-
18
-
19
-
20
-
21
-
22
-
23
-
24
-
25
-
26
-
27
-
28
-
29
-
30
-
31
-
32
-
33
-
34
-
35
-
36
-
37
-
38
-
39
-
40
-
41
-
42
-
43
-
44
-
45
-
46
-
47
-
48
-
49
-
50
-
51
-
52
-
53
-
54
-
55
-
56
-
57
-
58
-
59
-
60
-
61
-
62
-
63
-
64
-
65
-
66
-
67
-
68
-
69
-
70
-
 71
71 -
 72
72 -
 73
73 -
 74
74 -
 75
75 -
 76
76 -
 77
77 -
 78
78 -
 79
79 -
 80
80 -
 81
81 -
 82
82 -
 83
83 -
 84
84 -
 85
85 -
 86
86 -
 87
87 -
 88
88 -
 89
89 -
 90
90 -
 91
91 -
92
-
93
-
94
-
95
-
96
-
97
-
98
-
99
-
100
-
101
-
102
-
103
-
104
-
105
-
106
-
107
-
108
-
109
-
110
-
111
-
112
-
113
-
114
-
115
-
116
-
117
-
118
-
119
-
120
-
121
-
122
-
123
-
124
-
125
-
126
-
127
-
128
-
129
-
130
-
131
-
132
-
133
-
134
-
135
-
136
-
137
-
138
-
139
-
140
-
141
-
142
-
143
-
144
-
145
-
146
-
147
-
148
-
149
-
150
-
151
-
152
-
153
-
154
-
155
-
156
-
157
-
158
-
159
-
160
-
161
-
162
-
163
-
164
-
165
-
166
-
167
-
168
-
169
-
170
-
171
-
172
-
173
-
174
-
175
-
176
-
177
-
178
-
179
-
180
-
181
-
182
-
183
-
184
-
185
-
186
-
187
-
188
-
189
-
190
-
191
-
192
-
193
-
194
-
195
-
196
-
197
-
198
-
199
-
200
-
201
-
202
-
203
-
204
-
205
-
206
-
207
-
208
-
209
-
210
-
211
-
212
-
213
-
214
-
215
-
216
-
217
-
218
-
219
-
220
-
221
-
222
-
223
-
224
-
225
-
226
-
227
-
228
-
229
-
230
-
231
-
232
-
233
-
234
-
235
-
236
-
237
-
238
-
239
-
240
-
241
-
242
-
243
-
244
-
245
-
246
-
247
-
248
-
249
-
250
-
251
-
252
-
253
 |
 |

Table of Contents
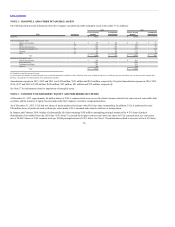
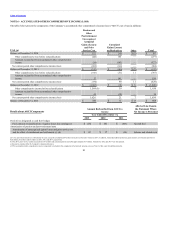
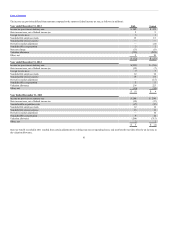
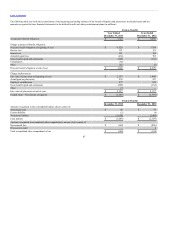
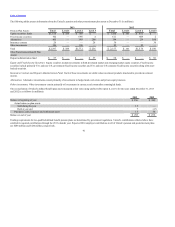
The tables below present the components of the Company’s accumulated other comprehensive income (loss) (“AOCI”), net of tax (in millions):
Balance at December 31, 2010 $ 152 $ 240 $ (5) $ 387
Other comprehensive loss before reclassifications (440) 163 — (277)
Amounts reclassified from accumulated other comprehensive
income (24) (503) — (527)
Net current-period other comprehensive income (loss) (464) (340) — (804)
Balance at December 31, 2011 $ (312) $ (100) $ (5) $ (417)
Other comprehensive loss before reclassifications (747) (51) 11 (787)
Amounts reclassified from accumulated other comprehensive
income 17 141 — 158
Net current-period other comprehensive income (loss) (730) 90 11 (629)
Balance at December 31, 2012 $ (1,042) $ (10) $ 6 $ (1,046)
Other comprehensive income before reclassifications 1,584 (b) 39 7 1,630
Amounts reclassified from accumulated other comprehensive
income 42 (18) — 24
Net current-period other comprehensive income (loss) 1,626 21 7 1,654
Balance at December 31, 2013 $ 584 $ 11 $ 13 $ 608
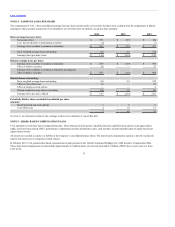
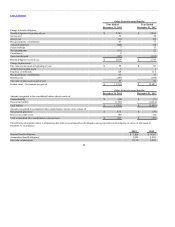
Derivatives designated as cash flow hedges
Fuel contracts-reclassifications of (gains) losses into earnings (c) $ (18) $ 141 $ (503) Aircraft fuel
Amortization of pension and post-retirement items
Amortization of unrecognized (gains) losses and prior service cost
and the effect of curtailments and settlements (c) (d) $ 42 $ 17 $ (24) Salaries and related costs
(a) UAL and United amounts are substantially the same except for an additional $6 million of income tax benefit at United in 2013. In addition, United had additional (losses) gains related to investments and other of
$(2) million, $1 million and $1 million in 2011, 2012 and 2013, respectively.
(b) For 2013, prior service credits increased by $331 million and actuarial gains increased by approximately $1.3 billion. Amounts for 2012 and 2011 were not material.
(c)Income tax expense offset by Company’s valuation allowance.
(d) This accumulated other comprehensive income component is included in the computation of net periodic pension costs (see Note 8 of this report for additional details).
81