Supercuts 2012 Annual Report Download - page 88
Download and view the complete annual report
Please find page 88 of the 2012 Supercuts annual report below. You can navigate through the pages in the report by either clicking on the pages listed below, or by using the keyword search tool below to find specific information within the annual report.-
 1
1 -
2
-
3
-
4
-
5
-
6
-
7
-
8
-
9
-
10
-
11
-
12
-
13
-
14
-
15
-
16
-
17
-
18
-
19
-
20
-
21
-
22
-
23
-
24
-
25
-
26
-
27
-
28
-
29
-
30
-
31
-
32
-
33
-
34
-
35
-
36
-
37
-
38
-
39
-
40
-
41
-
42
-
43
-
44
-
45
-
46
-
47
-
48
-
49
-
50
-
51
-
52
-
53
-
54
-
55
-
56
-
57
-
58
-
59
-
60
-
61
-
62
-
63
-
64
-
65
-
66
-
67
-
68
-
69
-
70
-
71
-
72
-
73
-
74
-
75
-
76
-
77
-
 78
78 -
 79
79 -
 80
80 -
 81
81 -
 82
82 -
 83
83 -
 84
84 -
 85
85 -
 86
86 -
 87
87 -
 88
88 -
 89
89 -
 90
90 -
 91
91 -
 92
92 -
 93
93 -
 94
94 -
 95
95 -
 96
96 -
 97
97 -
 98
98 -
99
-
100
-
101
-
102
-
103
-
104
-
105
-
106
-
107
-
108
-
109
-
110
-
111
-
112
-
113
-
114
-
115
-
116
-
117
-
118
-
119
-
120
-
121
-
122
-
123
-
124
-
125
-
126
-
127
-
128
-
129
-
130
-
131
-
132
-
133
-
134
-
135
-
136
-
137
-
138
-
139
-
140
-
141
-
142
-
143
-
144
-
145
-
146
-
147
-
148
-
149
-
150
-
151
-
152
-
153
-
154
-
155
-
156
-
157
-
158
-
159
-
160
-
161
-
162
-
163
-
164
-
165
-
166
-
167
-
168
-
169
-
170
-
171
-
172
-
173
-
174
-
175
-
176
-
177
-
178
-
179
-
180
-
181
 |
 |

Table of Contents
NOTES TO CONSOLIDATED FINANCIAL STATEMENTS (Continued)
1. BUSINESS DESCRIPTION AND SUMMARY OF SIGNIFICANT ACCOUNTING POLICIES (Continued)
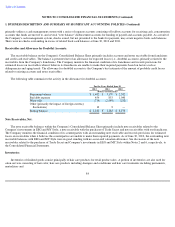
relaxers. Inventories are stated at the lower of cost or market, with cost determined on a weighted average cost basis.
Physical inventory counts are performed annually. Product and service inventories are adjusted based on the results of the physical
inventory counts. Between the physical inventory counts, cost of retail product sold to salon guests is determined based on the weighted
average cost of product sold, adjusted for an estimated shrinkage factor, and the cost of product used in salon services is determined by
applying estimated gross profit margins to service revenues. The estimated gross profit margins related to service inventories are updated semi-
annually based on the results of the physical inventory counts and other factors that could impact the Company's margin rate estimates such as
mix of service sales, discounting and special promotions. Actual results for the estimated gross margin percentage as compared to the semi-
annual estimates have not historically resulted in material adjustments to our Statement of Operations.
Property and Equipment:
Property and equipment are carried at cost, less accumulated depreciation and amortization. Depreciation and amortization of property and
equipment are computed on the straight-line method over estimated useful asset lives (30 to 39 years for buildings, 10 years for improvements
and three to ten years for equipment, furniture and software). Depreciation expense was $101.7, $88.6, and $92.5 million in fiscal years 2012,
2011, and 2010, respectively. Leasehold improvements are amortized over the shorter of their estimated useful lives or the related lease term,
generally ten years. For leases with renewal periods at the Company's option, management may determine at the inception of the lease that
renewal is reasonably assured if failure to exercise a renewal option imposes an economic penalty to the Company. In such cases, the Company
will include the renewal option period along with the original lease term in the determination of appropriate estimated useful lives.
The Company capitalizes both internal and external costs of developing or obtaining computer software for internal use. Costs incurred to
develop internal-use software during the application development stage are capitalized, while data conversion, training and maintenance costs
associated with internal-
use software are expensed as incurred. At June 30, 2012 and 2011, the net book value of capitalized software costs was
$26.7 and $34.1 million, respectively. Depreciation expense related to capitalized software was $22.3, $8.4, and $8.5 million in fiscal years
2012, 2011, and 2010, respectively, which has been determined based on an estimated useful life of five or seven years.
Historically, because of the Company's large size and scale requirements it has been necessary for the Company to internally develop and
support its own proprietary point-of-sale (POS) information system. During the fourth quarter of fiscal year 2011, the Company identified a
third party POS alternative that has a system that meets current and future functionality requirements including enhanced guest demographics.
At June 30, 2011, the Company reassessed and adjusted the remaining useful life of the Company's capitalized POS software to six months as
locations using the Company's existing POS information system move to a third party POS alternative by December 31, 2011. Based on the
results of the implementation of the third party POS alternative during each of the three month periods ended March 31, 2012 and
December 31, 2011, the Company reassessed and extended the useful life of the Company's capitalized POS software by three months.
Depreciation expense related to the existing POS information system during the twelve months ended June 30, 2012, included $16.2 million
($10.2 million net of tax or $0.18 per diluted share) of accelerated depreciation related to the
85