Supercuts 2012 Annual Report Download - page 48
Download and view the complete annual report
Please find page 48 of the 2012 Supercuts annual report below. You can navigate through the pages in the report by either clicking on the pages listed below, or by using the keyword search tool below to find specific information within the annual report.-
 1
1 -
2
-
3
-
4
-
5
-
6
-
7
-
8
-
9
-
10
-
11
-
12
-
13
-
14
-
15
-
16
-
17
-
18
-
19
-
20
-
21
-
22
-
23
-
24
-
25
-
26
-
27
-
28
-
29
-
30
-
31
-
32
-
33
-
34
-
35
-
36
-
37
-
 38
38 -
 39
39 -
 40
40 -
 41
41 -
 42
42 -
 43
43 -
 44
44 -
 45
45 -
 46
46 -
 47
47 -
 48
48 -
 49
49 -
 50
50 -
 51
51 -
 52
52 -
 53
53 -
 54
54 -
 55
55 -
 56
56 -
 57
57 -
 58
58 -
59
-
60
-
61
-
62
-
63
-
64
-
65
-
66
-
67
-
68
-
69
-
70
-
71
-
72
-
73
-
74
-
75
-
76
-
77
-
78
-
79
-
80
-
81
-
82
-
83
-
84
-
85
-
86
-
87
-
88
-
89
-
90
-
91
-
92
-
93
-
94
-
95
-
96
-
97
-
98
-
99
-
100
-
101
-
102
-
103
-
104
-
105
-
106
-
107
-
108
-
109
-
110
-
111
-
112
-
113
-
114
-
115
-
116
-
117
-
118
-
119
-
120
-
121
-
122
-
123
-
124
-
125
-
126
-
127
-
128
-
129
-
130
-
131
-
132
-
133
-
134
-
135
-
136
-
137
-
138
-
139
-
140
-
141
-
142
-
143
-
144
-
145
-
146
-
147
-
148
-
149
-
150
-
151
-
152
-
153
-
154
-
155
-
156
-
157
-
158
-
159
-
160
-
161
-
162
-
163
-
164
-
165
-
166
-
167
-
168
-
169
-
170
-
171
-
172
-
173
-
174
-
175
-
176
-
177
-
178
-
179
-
180
-
181
 |
 |

Table of Contents
economy. In addition, service revenues decreased due to the strengthening of the United States dollar against the British pound. Partially
offsetting the decrease was growth due to acquisitions during the twelve months and the weakening of the United States dollar against the
Canadian dollar during the twelve months ended June 30, 2010.
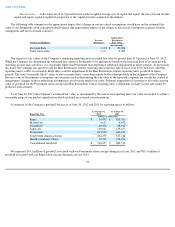
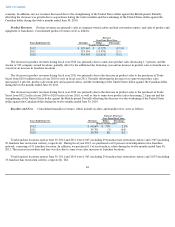
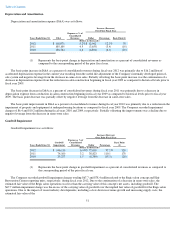
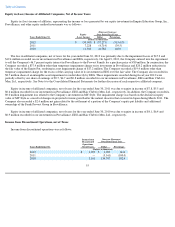
Product Revenues. Product revenues are primarily sales at company-
owned salons and hair restoration centers, and sales of product and
equipment to franchisees. Consolidated product revenues were as follows:
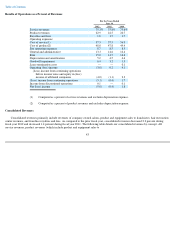
The decrease in product revenues during fiscal year 2012 was primarily due to same-store product sales decreasing 1.7 percent, and the
closure of 333 company-
owned locations, partially offset by the additional day from leap year and an increase in product sales to franchisees as
a result of an increase in franchise locations.
The decrease in product revenues during fiscal year 2011 was primarily due to the decrease in product sales to the purchaser of Trade
Secret from $20.0 million in fiscal year 2010 to zero in fiscal year 2011. Partially offsetting the decrease was same-store product sales
increasing 0.4 percent, product sales from new and acquired salons, and the weakening of the United States dollar against the Canadian dollar
during the twelve months ended June 30, 2011.
The decrease in product revenues during fiscal year 2010 was primarily due to the decrease in product sales to the purchaser of Trade
Secret from $32.2 in fiscal year 2009 to $20.0 in fiscal year 2010, as well as due to same-store product sales decreasing 2.3 percent and the
strengthening of the United States dollar against the British pound. Partially offsetting the decrease was the weakening of the United States
dollar against the Canadian dollar during the twelve months ended June 30, 2010.
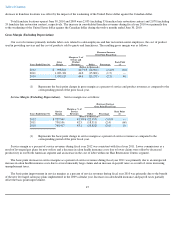
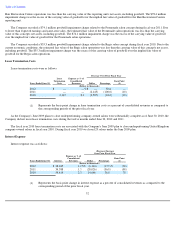
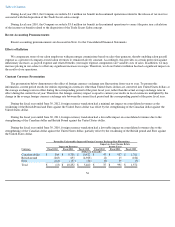
Royalties and Fees. Consolidated franchise revenues, which include royalties and franchise fees, were as follows:
Total franchise locations open at June 30, 2012 and 2011 were 2,045 (including 29 franchise hair restoration centers) and 1,965 (including
29 franchise hair restoration centers), respectively. During fiscal year 2012, we purchased a 60.0 percent ownership interest in a franchise
network, consisting of 31 franchise locations. In addition, we purchased 11 of our franchise salons during the twelve months ended June 30,
2012. The increase in royalties and fees was also due to same-store sales increases at franchise locations.
Total franchise locations open at June 30, 2011 and 2010 were 1,965 (including 29 franchise hair restoration centers) and 2,053 (including
33 franchise hair restoration centers), respectively. The
46
Decrease
Over Prior Fiscal Year
Years Ended June 30, Revenues Dollar Percentage
(Dollars in thousands)
2012
$
520,467
$
(2,727
)
(0.5
)%
2011
523,194
(11,399
)
(2.1
)
2010
534,593
(21,612
)
(3.9
)
Increase (Decrease)
Over Prior Fiscal Year
Years Ended June 30, Revenues Dollar Percentage
(Dollars in thousands)
2012
$
40,609
$
908
2.3
%
2011
39,701
(3
)
(0.0
)
2010
39,704
80
0.2