Supercuts 2012 Annual Report Download - page 63
Download and view the complete annual report
Please find page 63 of the 2012 Supercuts annual report below. You can navigate through the pages in the report by either clicking on the pages listed below, or by using the keyword search tool below to find specific information within the annual report.-
 1
1 -
2
-
3
-
4
-
5
-
6
-
7
-
8
-
9
-
10
-
11
-
12
-
13
-
14
-
15
-
16
-
17
-
18
-
19
-
20
-
21
-
22
-
23
-
24
-
25
-
26
-
27
-
28
-
29
-
30
-
31
-
32
-
33
-
34
-
35
-
36
-
37
-
38
-
39
-
40
-
41
-
42
-
43
-
44
-
45
-
46
-
47
-
48
-
49
-
50
-
51
-
52
-
 53
53 -
 54
54 -
 55
55 -
 56
56 -
 57
57 -
 58
58 -
 59
59 -
 60
60 -
 61
61 -
 62
62 -
 63
63 -
 64
64 -
 65
65 -
 66
66 -
 67
67 -
 68
68 -
 69
69 -
 70
70 -
 71
71 -
 72
72 -
 73
73 -
74
-
75
-
76
-
77
-
78
-
79
-
80
-
81
-
82
-
83
-
84
-
85
-
86
-
87
-
88
-
89
-
90
-
91
-
92
-
93
-
94
-
95
-
96
-
97
-
98
-
99
-
100
-
101
-
102
-
103
-
104
-
105
-
106
-
107
-
108
-
109
-
110
-
111
-
112
-
113
-
114
-
115
-
116
-
117
-
118
-
119
-
120
-
121
-
122
-
123
-
124
-
125
-
126
-
127
-
128
-
129
-
130
-
131
-
132
-
133
-
134
-
135
-
136
-
137
-
138
-
139
-
140
-
141
-
142
-
143
-
144
-
145
-
146
-
147
-
148
-
149
-
150
-
151
-
152
-
153
-
154
-
155
-
156
-
157
-
158
-
159
-
160
-
161
-
162
-
163
-
164
-
165
-
166
-
167
-
168
-
169
-
170
-
171
-
172
-
173
-
174
-
175
-
176
-
177
-
178
-
179
-
180
-
181
 |
 |

Table of Contents
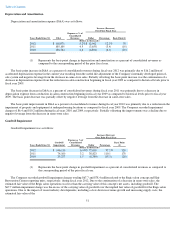
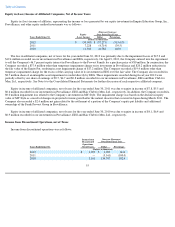
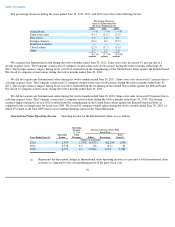
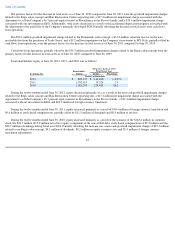
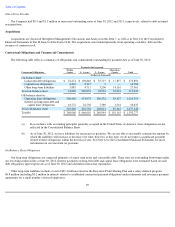
Hair Restoration Center Operating (Loss) Income. Operating (loss) income for our Hair Restoration Centers was as follows:
The basis point decrease in Hair Restoration Centers operating loss as a percent of Hair Restoration Centers revenues during the twelve
months ended June 30, 2012 was primarily due to the $78.4 million goodwill impairment of the Hair Restoration Centers, lower margins due
primarily to increased labor costs and an increase in the cost hair systems.
The basis point decrease in Hair Restoration Centers operating income as a percent of Hair Restoration Centers revenues during the twelve
months ended June 30, 2011 was primarily due to an increase in the cost of hair systems and expenses associated with a legal claim. Partially
offsetting the basis point decrease was a benefit related to a favorable ruling on a state sales tax issue.
The basis point decrease in Hair Restoration Centers operating income as a percent of Hair Restoration Centers revenues during the twelve
months ended June 30, 2010 was primarily due to an increase in advertising spend and the settlement of a vendor dispute totaling $0.6 million.
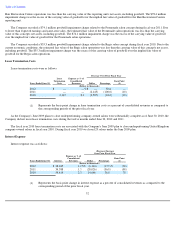
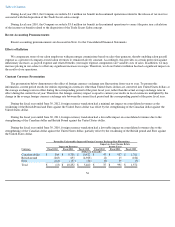
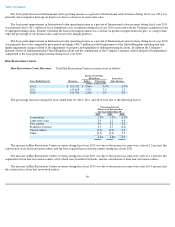
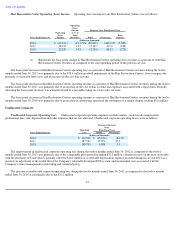
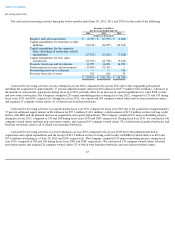
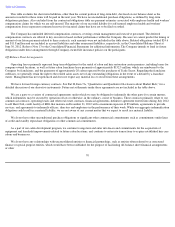
Unallocated Corporate
Unallocated Corporate Operating Loss. Unallocated corporate operating expenses include salaries, stock-based compensation,
professional fees, rent, depreciation and other expenses that are not allocated. Unallocated corporate operating losses were as follows:
The improvement in unallocated corporate operating loss during the twelve months ended June 30, 2012 as compared to the twelve
months ended June 30, 2011 was primarily due to the comparable prior period including $31.2 million valuation reserve on the note receivable
with the purchaser of Trade Secret, partially offset by $16.2 million of accelerated depreciation expense recorded during fiscal year 2012 as a
result of an adjustment to the useful life of the Company's internally developed POS system, and incremental costs associated with the
Company's senior management restructuring and contested proxy.
The increase in unallocated corporate operating loss during the twelve months ended June 30, 2011 as compared to the twelve months
ended June 30, 2010 was primarily due to the $31.2 million
61
Operating
(Loss)
Income
as % of
Total
Revenues
Decrease Over Prior Fiscal Year
Years Ended June 30,
Operating
(Loss)
Income Dollar Percentage Basis
Point(1)
(Dollars in thousands)
2012
$
(62,639
)
(41.3
)%
$
(80,869
)
(443.6
)%
(5,380
)
2011
18,230
12.5
(2,107
)
(10.4
)
(180
)
2010
20,337
14.3
(3,534
)
(14.8
)
(270
)
(1) Represents the basis point change in Hair Restoration Centers operating (loss) income as a percent of total Hair
Restoration Centers revenues as compared to the corresponding period of the prior fiscal year.
(Decrease) Increase
Over
Prior Fiscal Year
Operating
Loss
Years Ended June 30, Dollar Percentage
(Dollars in thousands)
2012
$
172,547
$
(15,156
)
(8.1
)%
2011
187,703
37,950
25.3
2010
149,753
4,808
3.3