Supercuts 2012 Annual Report Download - page 54
Download and view the complete annual report
Please find page 54 of the 2012 Supercuts annual report below. You can navigate through the pages in the report by either clicking on the pages listed below, or by using the keyword search tool below to find specific information within the annual report.-
 1
1 -
2
-
3
-
4
-
5
-
6
-
7
-
8
-
9
-
10
-
11
-
12
-
13
-
14
-
15
-
16
-
17
-
18
-
19
-
20
-
21
-
22
-
23
-
24
-
25
-
26
-
27
-
28
-
29
-
30
-
31
-
32
-
33
-
34
-
35
-
36
-
37
-
38
-
39
-
40
-
41
-
42
-
43
-
 44
44 -
 45
45 -
 46
46 -
 47
47 -
 48
48 -
 49
49 -
 50
50 -
 51
51 -
 52
52 -
 53
53 -
 54
54 -
 55
55 -
 56
56 -
 57
57 -
 58
58 -
 59
59 -
 60
60 -
 61
61 -
 62
62 -
 63
63 -
 64
64 -
65
-
66
-
67
-
68
-
69
-
70
-
71
-
72
-
73
-
74
-
75
-
76
-
77
-
78
-
79
-
80
-
81
-
82
-
83
-
84
-
85
-
86
-
87
-
88
-
89
-
90
-
91
-
92
-
93
-
94
-
95
-
96
-
97
-
98
-
99
-
100
-
101
-
102
-
103
-
104
-
105
-
106
-
107
-
108
-
109
-
110
-
111
-
112
-
113
-
114
-
115
-
116
-
117
-
118
-
119
-
120
-
121
-
122
-
123
-
124
-
125
-
126
-
127
-
128
-
129
-
130
-
131
-
132
-
133
-
134
-
135
-
136
-
137
-
138
-
139
-
140
-
141
-
142
-
143
-
144
-
145
-
146
-
147
-
148
-
149
-
150
-
151
-
152
-
153
-
154
-
155
-
156
-
157
-
158
-
159
-
160
-
161
-
162
-
163
-
164
-
165
-
166
-
167
-
168
-
169
-
170
-
171
-
172
-
173
-
174
-
175
-
176
-
177
-
178
-
179
-
180
-
181
 |
 |

Table of Contents
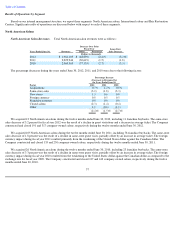
Hair Restoration Centers operations was less than the carrying value of this reporting unit's net assets, including goodwill. The $78.4 million
impairment charge was the excess of the carrying value of goodwill over the implied fair value of goodwill for the Hair Restoration Centers
reporting unit.
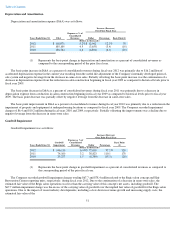
The Company recorded a $74.1 million goodwill impairment charge related to the Promenade salon concept during fiscal year 2011. Due
to lower than expected earnings and same-store sales, the estimated fair value of the Promenade salon operations was less than the carrying
value of this concept's net assets, including goodwill. The $74.1 million impairment charge was the excess of the carrying value of goodwill
over the implied fair value of goodwill for the Promenade salon operations.
The Company recorded a $35.3 million goodwill impairment charge related to the Regis salon concept during fiscal year 2010. Due to the
current economic conditions, the estimated fair value of the Regis salon operations was less than the carrying value of this concept's net assets,
including goodwill. The $35.3 million impairment charge was the excess of the carrying value of goodwill over the implied fair value of
goodwill for the Regis salon operations.
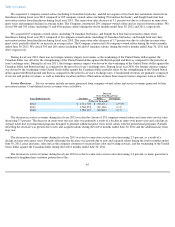
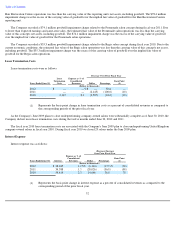
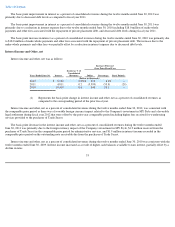
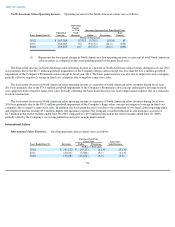
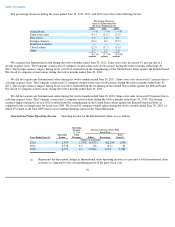
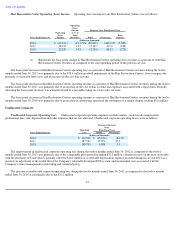
Lease Termination Costs
Lease termination costs were as follows:
As the Company's June 2009 plans to close underperforming company-owned salons were substantially complete as of June 30, 2010, the
Company did not incur lease termination costs during the twelve months ended June 30, 2012 and 2011.
The fiscal year 2010 lease termination costs are associated with the Company's June 2009 plan to close underperforming United Kingdom
company-owned salons in fiscal year 2010. During fiscal year 2010 we closed 29 salons under the June 2009 plan.
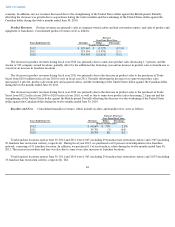
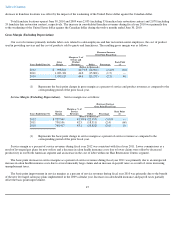
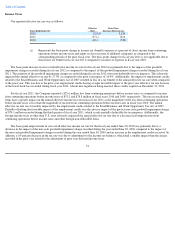
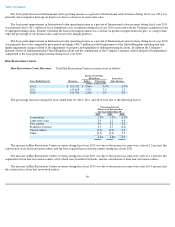
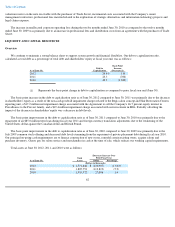
Interest Expense
Interest expense was as follows:
52
Decrease Over Prior Fiscal Year
Years Ended June 30,
Lease
Termination
Costs
Expense as % of
Consolidated
Revenues Dollar Percentage Basis Point
(1)
(Dollars in thousands)
2012
$
—
—
%
$
—
N/A
—
2011
—
—
(
2,145
)
(100.0
)
(10
)
2010
2,145
0.1
(3,587
)
(62.6
)
(10
)
(1) Represents the basis point change in lease termination costs as a percent of consolidated revenues as compared to
the corresponding periods of the prior fiscal year.
(Decrease) Increase
Over Prior Fiscal Year
Years Ended June 30, Interest
Expense as % of
Consolidated
Revenues Dollar Percentage Basis Point
(1)
(Dollars in thousands)
2012
$
28,245
1.2
%
$
(6,143
)
(17.9
)%
(30
)
2011
34,388
1.5
(20,026
)
(36.8
)
(80
)
2010
54,414
2.3
14,646
36.8
70
(1) Represents the basis point change in interest expense as a percent of consolidated revenues as compared to the
corresponding period of the prior fiscal year.