Supercuts 2012 Annual Report Download - page 141
Download and view the complete annual report
Please find page 141 of the 2012 Supercuts annual report below. You can navigate through the pages in the report by either clicking on the pages listed below, or by using the keyword search tool below to find specific information within the annual report.-
 1
1 -
2
-
3
-
4
-
5
-
6
-
7
-
8
-
9
-
10
-
11
-
12
-
13
-
14
-
15
-
16
-
17
-
18
-
19
-
20
-
21
-
22
-
23
-
24
-
25
-
26
-
27
-
28
-
29
-
30
-
31
-
32
-
33
-
34
-
35
-
36
-
37
-
38
-
39
-
40
-
41
-
42
-
43
-
44
-
45
-
46
-
47
-
48
-
49
-
50
-
51
-
52
-
53
-
54
-
55
-
56
-
57
-
58
-
59
-
60
-
61
-
62
-
63
-
64
-
65
-
66
-
67
-
68
-
69
-
70
-
71
-
72
-
73
-
74
-
75
-
76
-
77
-
78
-
79
-
80
-
81
-
82
-
83
-
84
-
85
-
86
-
87
-
88
-
89
-
90
-
91
-
92
-
93
-
94
-
95
-
96
-
97
-
98
-
99
-
100
-
101
-
102
-
103
-
104
-
105
-
106
-
107
-
108
-
109
-
110
-
111
-
112
-
113
-
114
-
115
-
116
-
117
-
118
-
119
-
120
-
121
-
122
-
123
-
124
-
125
-
126
-
127
-
128
-
129
-
130
-
 131
131 -
 132
132 -
 133
133 -
 134
134 -
 135
135 -
 136
136 -
 137
137 -
 138
138 -
 139
139 -
 140
140 -
 141
141 -
 142
142 -
 143
143 -
 144
144 -
 145
145 -
 146
146 -
 147
147 -
 148
148 -
 149
149 -
 150
150 -
 151
151 -
152
-
153
-
154
-
155
-
156
-
157
-
158
-
159
-
160
-
161
-
162
-
163
-
164
-
165
-
166
-
167
-
168
-
169
-
170
-
171
-
172
-
173
-
174
-
175
-
176
-
177
-
178
-
179
-
180
-
181
 |
 |

Table of Contents
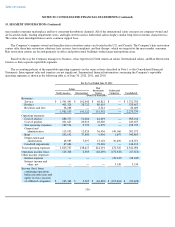
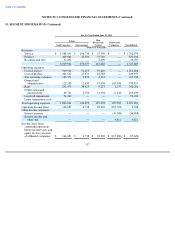
NOTES TO CONSOLIDATED FINANCIAL STATEMENTS (Continued)
15. SEGMENT INFORMATION (Continued)
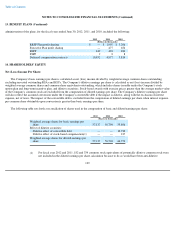
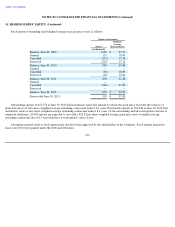
Total revenues and long-lived assets associated with business operations in the U.S. and all other countries in aggregate were as follows:
138
For the Year Ended June 30, 2010
Salons
Hair
Restoration
Centers Unallocated
Corporate
North America International Consolidated
(Dollars in thousands)
Revenues:
Service
$
1,605,979
$
111,833
$
66,325
$
—
$
1,784,137
Product
417,363
44,252
72,978
—
534,593
Royalties and fees
37,221
—
2,483
—
39,704
2,060,563
156,085
141,786
—
2,358,434
Operating expenses:
Cost of service
920,905
57,657
37,158
—
1,015,720
Cost of product
219,745
22,570
21,568
—
263,883
Site operating expenses
183,881
10,152
5,305
—
199,338
General and
administrative
113,956
13,115
36,207
128,713
291,991
Rent
294,263
38,681
9,013
2,141
344,098
Depreciation and
amortization
72,681
4,986
12,198
18,899
108,764
Goodwill impairment
35,277
—
—
—
35,277
Lease termination costs
—
2,145
—
—
2,145
Total operating expenses
1,840,708
149,306
121,449
149,753
2,261,216
Operating income (loss)
219,855
6,779
20,337
(149,753
)
97,218
Other income (expense):
Interest expense
—
—
—
(
54,414
)
(54,414
)
Interest income and
other, net
—
—
—
10,410
10,410
Income (loss) from
continuing operations
before income taxes and
equity in (loss) income
of affiliated companies
$
219,855
$
6,779
$
20,337
$
(193,757
)
$
53,214
Year Ended June 30,
2012 2011 2010
Total
Revenues Long-lived
Assets Total
Revenues Long-lived
Assets Total
Revenues Long-lived
Assets
(Dollars in thousands)
U.S.
$
1,967,349
$
291,972
$
2,007,042
$
314,406
$
2,055,059
$
327,753
Other countries
306,430
31,088
318,827
33,405
303,375
31,497
Total
$
2,273,779
$
323,060
$
2,325,869
$
347,811
$
2,358,434
$
359,250