Supercuts 2012 Annual Report Download - page 30
Download and view the complete annual report
Please find page 30 of the 2012 Supercuts annual report below. You can navigate through the pages in the report by either clicking on the pages listed below, or by using the keyword search tool below to find specific information within the annual report.-
 1
1 -
2
-
3
-
4
-
5
-
6
-
7
-
8
-
9
-
10
-
11
-
12
-
13
-
14
-
15
-
16
-
17
-
18
-
19
-
 20
20 -
 21
21 -
 22
22 -
 23
23 -
 24
24 -
 25
25 -
 26
26 -
 27
27 -
 28
28 -
 29
29 -
 30
30 -
 31
31 -
 32
32 -
 33
33 -
 34
34 -
 35
35 -
 36
36 -
 37
37 -
 38
38 -
 39
39 -
 40
40 -
41
-
42
-
43
-
44
-
45
-
46
-
47
-
48
-
49
-
50
-
51
-
52
-
53
-
54
-
55
-
56
-
57
-
58
-
59
-
60
-
61
-
62
-
63
-
64
-
65
-
66
-
67
-
68
-
69
-
70
-
71
-
72
-
73
-
74
-
75
-
76
-
77
-
78
-
79
-
80
-
81
-
82
-
83
-
84
-
85
-
86
-
87
-
88
-
89
-
90
-
91
-
92
-
93
-
94
-
95
-
96
-
97
-
98
-
99
-
100
-
101
-
102
-
103
-
104
-
105
-
106
-
107
-
108
-
109
-
110
-
111
-
112
-
113
-
114
-
115
-
116
-
117
-
118
-
119
-
120
-
121
-
122
-
123
-
124
-
125
-
126
-
127
-
128
-
129
-
130
-
131
-
132
-
133
-
134
-
135
-
136
-
137
-
138
-
139
-
140
-
141
-
142
-
143
-
144
-
145
-
146
-
147
-
148
-
149
-
150
-
151
-
152
-
153
-
154
-
155
-
156
-
157
-
158
-
159
-
160
-
161
-
162
-
163
-
164
-
165
-
166
-
167
-
168
-
169
-
170
-
171
-
172
-
173
-
174
-
175
-
176
-
177
-
178
-
179
-
180
-
181
 |
 |

Table of Contents
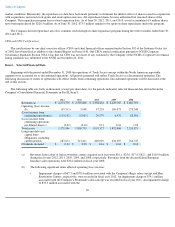
During fiscal year 2012, the Company was awarded $1.1 million in conjunction with a class-action lawsuit.
During fiscal year 2011, the Company settled a legal claim with the former owner of Hair Club for $1.7 million.
During fiscal year 2010, the Company settled two legal claims regarding certain guest and employee matters for an aggregate charge of
$5.2 million plus a commitment to provide discount coupons. During the twelve months ended June 30, 2011 and 2010, payments aggregating
$4.3 million and $0.9 million, respectively, were made.
Item 4. Mine Safety Disclosures
None.
PART II
Item 5. Market for Registrant's Common Equity, Related Stockholder Matters and Issuer Repurchase of Equity Securities
(a) Market Price of and Dividends on the Registrant's Common Equity and Related Stockholder Matters; Performance Graph
Regis common stock is listed and traded on the New York Stock Exchange under the symbol "RGS."
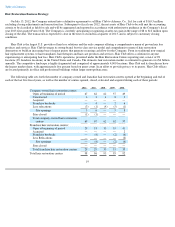
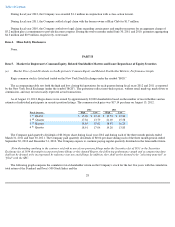
The accompanying table sets forth the high and low closing bid quotations for each quarter during fiscal years 2012 and 2011 as reported
by the New York Stock Exchange (under the symbol "RGS"). The quotations reflect inter-dealer prices, without retail mark-up, mark-down or
commission, and may not necessarily represent actual transactions.
As of August 13, 2012, Regis shares were owned by approximately 22,000 shareholders based on the number of record holders and an
estimate of individual participants in security position listings. The common stock price was $17.14 per share on August 13, 2012.
The Company paid quarterly dividends of $0.06 per share during fiscal year 2012 and during each of the three month periods ended
March 31, 2011 and June 30, 2011. The Company paid quarterly dividends of $0.04 per share during each of the three month periods ended
September 30, 2010 and December 31, 2010. The Company expects to continue paying regular quarterly dividends in the foreseeable future.
Notwithstanding anything to the contrary set forth in any of our previous filings under the Securities Act of 1933 or the Securities
Exchange Act of 1934 that might incorporate future filings or this Annual Report, the following performance graph and accompanying data
shall not be deemed to be incorporated by reference into any such filings. In addition, they shall not be deemed to be "soliciting material" or
"filed" with the SEC.
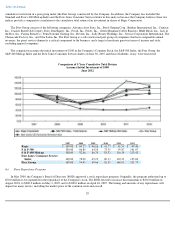
The following graph compares the cumulative total shareholder return on the Company's stock for the last five years with the cumulative
total return of the Standard and Poor's 500 Stock Index and the
28
2012 2011
Fiscal Quarter High Low High Low
1
st
Quarter
$
15.90
$
12.46
$
19.53
$
12.84
2
nd
Quarter
17.36
13.79
21.69
15.58
3
rd
Quarter
18.65
15.02
18.47
16.25
4
th
Quarter
18.91
17.04
19.20
13.83