Supercuts 2012 Annual Report Download - page 59
Download and view the complete annual report
Please find page 59 of the 2012 Supercuts annual report below. You can navigate through the pages in the report by either clicking on the pages listed below, or by using the keyword search tool below to find specific information within the annual report.-
 1
1 -
2
-
3
-
4
-
5
-
6
-
7
-
8
-
9
-
10
-
11
-
12
-
13
-
14
-
15
-
16
-
17
-
18
-
19
-
20
-
21
-
22
-
23
-
24
-
25
-
26
-
27
-
28
-
29
-
30
-
31
-
32
-
33
-
34
-
35
-
36
-
37
-
38
-
39
-
40
-
41
-
42
-
43
-
44
-
45
-
46
-
47
-
48
-
 49
49 -
 50
50 -
 51
51 -
 52
52 -
 53
53 -
 54
54 -
 55
55 -
 56
56 -
 57
57 -
 58
58 -
 59
59 -
 60
60 -
 61
61 -
 62
62 -
 63
63 -
 64
64 -
 65
65 -
 66
66 -
 67
67 -
 68
68 -
 69
69 -
70
-
71
-
72
-
73
-
74
-
75
-
76
-
77
-
78
-
79
-
80
-
81
-
82
-
83
-
84
-
85
-
86
-
87
-
88
-
89
-
90
-
91
-
92
-
93
-
94
-
95
-
96
-
97
-
98
-
99
-
100
-
101
-
102
-
103
-
104
-
105
-
106
-
107
-
108
-
109
-
110
-
111
-
112
-
113
-
114
-
115
-
116
-
117
-
118
-
119
-
120
-
121
-
122
-
123
-
124
-
125
-
126
-
127
-
128
-
129
-
130
-
131
-
132
-
133
-
134
-
135
-
136
-
137
-
138
-
139
-
140
-
141
-
142
-
143
-
144
-
145
-
146
-
147
-
148
-
149
-
150
-
151
-
152
-
153
-
154
-
155
-
156
-
157
-
158
-
159
-
160
-
161
-
162
-
163
-
164
-
165
-
166
-
167
-
168
-
169
-
170
-
171
-
172
-
173
-
174
-
175
-
176
-
177
-
178
-
179
-
180
-
181
 |
 |

Table of Contents
Results of Operations by Segment
Based on our internal management structure, we report three segments: North American salons, International salons and Hair Restoration
Centers. Significant results of operations are discussed below with respect to each of these segments.
North American Salons
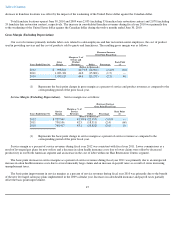
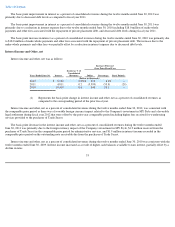
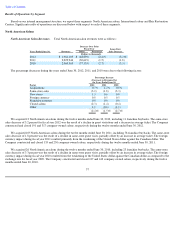
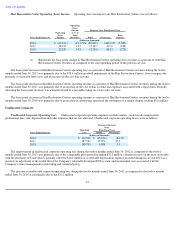
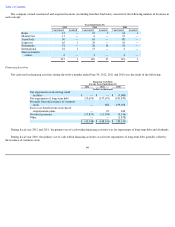
North American Salon Revenues. Total North American salon revenues were as follows:
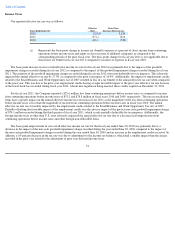
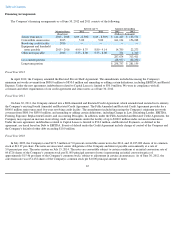
The percentage decreases during the years ended June 30, 2012, 2011, and 2010 were due to the following factors:
We acquired 12 North American salons during the twelve months ended June 30, 2012, including 11 franchise buybacks. The same-store
sales decrease of 3.2 percent for fiscal year 2012 was the result of a decline in guest visitations and a decrease in average ticket. The Company
constructed and closed 191 and 317 company-owned salons, respectively during the twelve months ended June 30, 2012.
We acquired 105 North American salons during the twelve months ended June 30, 2011, including 78 franchise buybacks. The same-
store
sales decrease of 1.8 percent was the result of a decline in same-store guest visits, partially offset by an increase in average ticket. The foreign
currency impact during fiscal year 2011 resulted primarily from the weakening of the United States dollar against the Canadian dollar. The
Company constructed and closed 133 and 230 company-owned salons, respectively during the twelve months ended June 30, 2011.
We acquired 26 North American salons during the twelve months ended June 30, 2010, including 23 franchise buybacks. The same-store
sales decrease of 3.3 percent was the result of a decline in same-store guest visits, partially offset by an increase in average ticket. The foreign
currency impact during fiscal year 2010 resulted from the weakening of the United States dollar against the Canadian dollar as compared to the
exchange rate for fiscal year 2009. The Company constructed and closed 137 and 162 company-owned salons, respectively during the twelve
months ended June 30, 2010.
57
Decrease Over Prior
Fiscal Year
Same-Store
Sales Decrease
Years Ended June 30, Revenues Dollar Percentage
(Dollars in thousands)
2012
$
1,981,105
$
(48,839
)
(2.4
)%
(3.2
)%
2011
2,029,944
(30,619
)
(1.5
)
(1.8
)
2010
2,060,563
(57,135
)
(2.7
)
(3.3
)
Percentage Increase
(Decrease) in Revenues For
the Years Ended June 30,
Factor 2012 2011 2010
Acquisitions
0.7
%
1.2
%
0.8
%
Same
-
store sales
(3.2
)
(1.8
)
(3.3
)
New stores
1.3
0.6
0.8
Foreign currency
0.0
0.5
0.5
Franchise revenues
0.0
0.0
0.0
Closed salons
(2.3
)
(1.4
)
(0.4
)
Other
1.1
(0.6
)
(1.1
)
(2.4
)%
(1.5
)%
(2.7
)%